OPEN-SOURCE SCRIPT
Telah dikemas kini [blackcat] L1 Relative Strength Volume-Adjusted EMA
Level 1
Background
Vitali Apirine proposed an idea of “Relative Strength Moving Averages, Part 2 (RS VA EMA)” on October 2022.
Function
Based on my understanding, Vitali combines the merits of RSI, volume and EMA to improve moving average performance. It takes the relative volume strength into account and includes a measurement between positive and negative volume flow in the calculation, which gives direction to the volume input. In details, volume is considered positive when the close is higher than the previous close and negative when the close is lower than the previous close. I used 2 period lagged signal as trigger so that the pair fast and slow lines can form golden cross and dead cross where entry signal can be produced.
Remarks
Feedbacks are appreciated.
Nota Keluaran
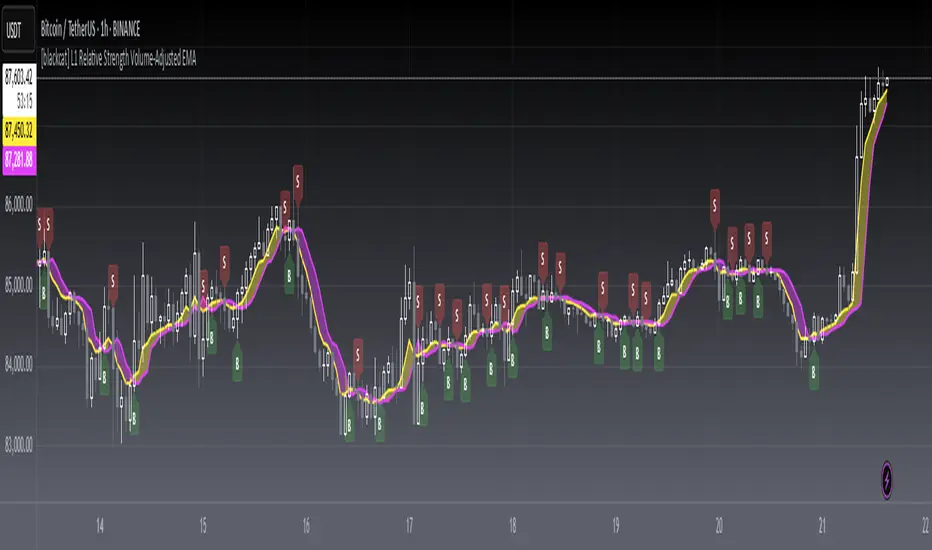
OVERVIEWThe [blackcat] L1 Relative Strength Volume-Adjusted EMA is a custom indicator for TradingView that combines relative strength and volume-adjustment with an exponential moving average. This innovative tool, developed by Vitali Apirine, provides traders with a unique perspective on price action by incorporating volume data into the calculation of the EMA. The indicator plots two lines: the main RS VA EMA and a trigger line, creating a visual representation of potential buy and sell signals. It also includes labels for easy identification of trading opportunities and customizable alerts for real-time notifications.
The script is designed to work on daily, weekly, and monthly timeframes, making it versatile for various trading strategies. Its primary goal is to help traders identify trends and potential reversals by highlighting the relationship between price movement and trading volume.
FEATURES
Customizable periods, PDs, and multiplier
Volume-adjusted exponential moving average
Visual representation of buy/sell signals
Customizable plot colors and styles
Labels for easy identification of trading opportunities
Customizable alerts for real-time notifications
HOW TO USE
Add the script to your TradingView chart
Adjust the input parameters (Periods, PDs, Mltp) according to your preferences
Observe the yellow and fuchsia lines on your chart
Look for crossovers between the main RS VA EMA and the trigger line
Use the 'B' and 'S' labels as potential buy and sell signals
Set up alerts for real-time notifications of trading opportunities
LIMITATIONS
Only works on daily, weekly, and monthly timeframes
May produce false signals in low-volume markets
Requires careful tuning of input parameters for optimal performance
NOTES
The indicator is based on the concept of relative strength and volume analysis
It's recommended to use this indicator in conjunction with other technical analysis tools
Always perform your own due diligence before making trading decisions
Skrip sumber terbuka
Dalam semangat TradingView sebenar, pencipta skrip ini telah menjadikannya sumber terbuka, jadi pedagang boleh menilai dan mengesahkan kefungsiannya. Terima kasih kepada penulis! Walaupuan anda boleh menggunakan secara percuma, ingat bahawa penerbitan semula kod ini tertakluk kepada Peraturan Dalaman.
Avoid losing contact!Don't miss out! The first and most important thing to do is to join my Discord chat now! Click here to start your adventure: discord.com/invite/ZTGpQJq 防止失联,请立即行动,加入本猫聊天群: discord.com/invite/ZTGpQJq
Penafian
Maklumat dan penerbitan adalah tidak bertujuan, dan tidak membentuk, nasihat atau cadangan kewangan, pelaburan, dagangan atau jenis lain yang diberikan atau disahkan oleh TradingView. Baca lebih dalam Terma Penggunaan.