OPEN-SOURCE SCRIPT
Telah dikemas kini Dynamic Portfolio Tracker
Dynamic Portfolio Tracker
The Dynamic Portfolio Tracker is a visual tool for actively managing and monitoring a multi-asset portfolio directly on TradingView. It allows users to input up to 15 custom assets (with a default setup for 5), define how much of each asset they hold, and assign a target allocation percentage to each. The script then calculates live market prices, total portfolio value, current vs. target weightings, and provides clear, color-coded instructions on whether to buy, sell, or hold each asset. It displays all this data in an on-chart table, showing both the dollar amount and the quantity to adjust for each asset, helping users keep their portfolio aligned with their strategy in real time.
How to Use the Inputs (What Each Field Means)
1. Portfolio Assets (Tickers)
Fields: Asset 1 Ticker, Asset 2 Ticker, …, Asset 15 Ticker
What it does: Lets you select which assets (crypto, stocks, etc.) you want to track. These are live symbols pulled from TradingView.
2. Asset Quantities
Fields: Asset 1 Amount, Asset 2 Amount, …, Asset 15 Amount
What it means: How much of each asset you currently hold. For example:
• 0.03 BTC
• 2.1 ETH
Why it’s needed: The script multiplies this by the live price to calculate the current dollar value of each asset in your portfolio.
3. Target %
Fields: Asset 1 Implied %, Asset 2 Implied %, …, Asset 15 Implied %
What it means: Your desired allocation for each asset. For example:
• 40% BTC
• 20% ETH
• 10% SOL, etc.
Important: These must total 100% or less across all assets. The script checks this and shows an error if the total exceeds 100%.
The Dynamic Portfolio Tracker displays two powerful on-chart tables:
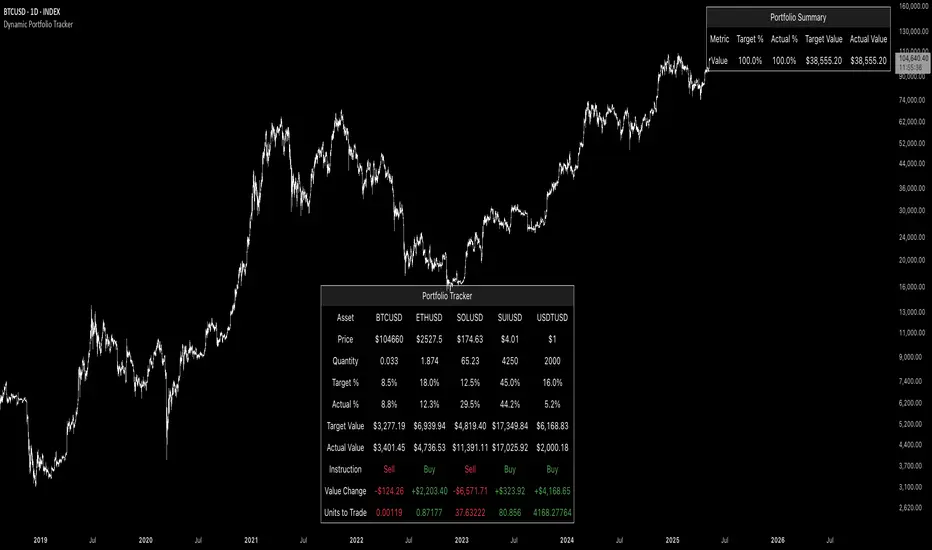
1. Main Table — Per Asset Breakdown
This table shows detailed, real-time information for each asset in your portfolio. Each row represents a different asset, and each column has a specific meaning:
Column What It Means
Asset = The symbol of the asset (e.g., BTCUSD, ETHUSD), auto-stripped from the exchange name.
Price = The current market price of the asset, pulled live from TradingView.
Quantity = How much of that asset you currently hold, entered manually in the inputs.
Target % = The percentage of your total portfolio you want this asset to represent.
Actual % = What percentage of your portfolio it currently makes up (based on price × quantity).
Target Value = How much (in $) this asset should be worth in your portfolio.
Actual Value = How much (in $) this asset is currently worth.
Instruction = Whether to Buy, Sell, or Hold to match your target allocation.
Value Change = The dollar amount you’d need to buy/sell to rebalance this asset.
Units to Trade = The number of asset units to buy/sell to reach the target value.
2. Portfolio Summary Table — Portfolio Totals
This smaller table appears in the top-right corner and summarizes your entire portfolio at a glance:
Target % = Total of all your assigned target allocations (should equal 100%).
Actual % = Actual portfolio composition (always 100% unless your capital is zero).
Target Value = Total value your portfolio should be based on your target percentages.
Actual Value = Current live total value of your portfolio.
If there’s a discrepancy between Target Value and Actual Value, the difference is shown in each row of the main table, so you can adjust individual assets accordingly.
Privacy First: Hide Sensitive Financial Data
A unique feature of this tool is the ability to hide sensitive financial data, such as:
• Target Value
• Actual Value
• Total Portfolio Value
You can turn these off using toggle settings, and they’ll be replaced with a crossed-out eye icon (👁️🗨️) — just like on modern crypto exchanges. This feature makes the script safe for streaming, screenshots, or sharing publicly while protecting your privacy.
But more importantly:
Feelings are the enemy of good investing.
Seeing the value of your portfolio fluctuate can trigger fear or greed. By hiding your dollar values, you’re not just securing your data — you’re reducing the temptation to react emotionally.
It’s just numbers. Systems over Feelings.
Table Automatically Adapts to Your Asset Count
The Dynamic Portfolio Tracker is designed to scale with your portfolio. Simply choose how many assets you want to track (up to 15), and the table will automatically resize to fit exactly that number — no wasted space or empty rows.
• Select 1 to 15 assets using the “Number of Assets” input
• The table expands or contracts dynamically to show only those rows
• All calculations, summaries, and layout elements adjust accordingly in real time
This keeps the interface clean, focused, and perfectly tailored to your setup — whether you’re tracking 3 coins or managing a full portfolio of 12+ tokens.
Customize Your Table to Match Your Style
The Dynamic Portfolio Tracker offers a full suite of visual customization options, allowing you to tailor the table to your charting style or stream layout. You can:
• Choose text colors for labels, values, and headers
• Set background colors for the full table and header row — or turn them off completely for a clean, transparent look
• Control border and frame settings, including color, thickness, or disabling them entirely
• Pick custom colors for Buy and Sell signals in the rebalance column
• Adjust table font size from tiny to large to match your resolution or preferences
Special Thanks
This tool wouldn’t exist without the knowledge and inspiration gained through The Real World. A sincere thank you to the Investing Master, the Guides, and Professor Adam — your frameworks and lessons brought clarity, discipline, and structure to this build.
And of course, glory to L4 — where real men are made.
The Dynamic Portfolio Tracker is a visual tool for actively managing and monitoring a multi-asset portfolio directly on TradingView. It allows users to input up to 15 custom assets (with a default setup for 5), define how much of each asset they hold, and assign a target allocation percentage to each. The script then calculates live market prices, total portfolio value, current vs. target weightings, and provides clear, color-coded instructions on whether to buy, sell, or hold each asset. It displays all this data in an on-chart table, showing both the dollar amount and the quantity to adjust for each asset, helping users keep their portfolio aligned with their strategy in real time.
How to Use the Inputs (What Each Field Means)
1. Portfolio Assets (Tickers)
Fields: Asset 1 Ticker, Asset 2 Ticker, …, Asset 15 Ticker
What it does: Lets you select which assets (crypto, stocks, etc.) you want to track. These are live symbols pulled from TradingView.
2. Asset Quantities
Fields: Asset 1 Amount, Asset 2 Amount, …, Asset 15 Amount
What it means: How much of each asset you currently hold. For example:
• 0.03 BTC
• 2.1 ETH
Why it’s needed: The script multiplies this by the live price to calculate the current dollar value of each asset in your portfolio.
3. Target %
Fields: Asset 1 Implied %, Asset 2 Implied %, …, Asset 15 Implied %
What it means: Your desired allocation for each asset. For example:
• 40% BTC
• 20% ETH
• 10% SOL, etc.
Important: These must total 100% or less across all assets. The script checks this and shows an error if the total exceeds 100%.
The Dynamic Portfolio Tracker displays two powerful on-chart tables:
1. Main Table — Per Asset Breakdown
This table shows detailed, real-time information for each asset in your portfolio. Each row represents a different asset, and each column has a specific meaning:
Column What It Means
Asset = The symbol of the asset (e.g., BTCUSD, ETHUSD), auto-stripped from the exchange name.
Price = The current market price of the asset, pulled live from TradingView.
Quantity = How much of that asset you currently hold, entered manually in the inputs.
Target % = The percentage of your total portfolio you want this asset to represent.
Actual % = What percentage of your portfolio it currently makes up (based on price × quantity).
Target Value = How much (in $) this asset should be worth in your portfolio.
Actual Value = How much (in $) this asset is currently worth.
Instruction = Whether to Buy, Sell, or Hold to match your target allocation.
Value Change = The dollar amount you’d need to buy/sell to rebalance this asset.
Units to Trade = The number of asset units to buy/sell to reach the target value.
2. Portfolio Summary Table — Portfolio Totals
This smaller table appears in the top-right corner and summarizes your entire portfolio at a glance:
Target % = Total of all your assigned target allocations (should equal 100%).
Actual % = Actual portfolio composition (always 100% unless your capital is zero).
Target Value = Total value your portfolio should be based on your target percentages.
Actual Value = Current live total value of your portfolio.
If there’s a discrepancy between Target Value and Actual Value, the difference is shown in each row of the main table, so you can adjust individual assets accordingly.
Privacy First: Hide Sensitive Financial Data
A unique feature of this tool is the ability to hide sensitive financial data, such as:
• Target Value
• Actual Value
• Total Portfolio Value
You can turn these off using toggle settings, and they’ll be replaced with a crossed-out eye icon (👁️🗨️) — just like on modern crypto exchanges. This feature makes the script safe for streaming, screenshots, or sharing publicly while protecting your privacy.
But more importantly:
Feelings are the enemy of good investing.
Seeing the value of your portfolio fluctuate can trigger fear or greed. By hiding your dollar values, you’re not just securing your data — you’re reducing the temptation to react emotionally.
It’s just numbers. Systems over Feelings.
Table Automatically Adapts to Your Asset Count
The Dynamic Portfolio Tracker is designed to scale with your portfolio. Simply choose how many assets you want to track (up to 15), and the table will automatically resize to fit exactly that number — no wasted space or empty rows.
• Select 1 to 15 assets using the “Number of Assets” input
• The table expands or contracts dynamically to show only those rows
• All calculations, summaries, and layout elements adjust accordingly in real time
This keeps the interface clean, focused, and perfectly tailored to your setup — whether you’re tracking 3 coins or managing a full portfolio of 12+ tokens.
Customize Your Table to Match Your Style
The Dynamic Portfolio Tracker offers a full suite of visual customization options, allowing you to tailor the table to your charting style or stream layout. You can:
• Choose text colors for labels, values, and headers
• Set background colors for the full table and header row — or turn them off completely for a clean, transparent look
• Control border and frame settings, including color, thickness, or disabling them entirely
• Pick custom colors for Buy and Sell signals in the rebalance column
• Adjust table font size from tiny to large to match your resolution or preferences
Special Thanks
This tool wouldn’t exist without the knowledge and inspiration gained through The Real World. A sincere thank you to the Investing Master, the Guides, and Professor Adam — your frameworks and lessons brought clarity, discipline, and structure to this build.
And of course, glory to L4 — where real men are made.
Nota Keluaran
Dynamic Portfolio TrackerThe Dynamic Portfolio Tracker is a visual tool for actively managing and monitoring a multi-asset portfolio directly on TradingView. It allows users to input up to 15 custom assets (with a default setup for 5), define how much of each asset they hold, and assign a target allocation percentage to each. The script then calculates live market prices, total portfolio value, current vs. target weightings, and provides clear, color-coded instructions on whether to buy, sell, or hold each asset. It displays all this data in an on-chart table, showing both the dollar amount and the quantity to adjust for each asset, helping users keep their portfolio aligned with their strategy in real time.
How to Use the Inputs (What Each Field Means)
1. Portfolio Assets (Tickers)
Fields: Asset 1 Ticker, Asset 2 Ticker, …, Asset 15 Ticker
What it does: Lets you select which assets (crypto, stocks, etc.) you want to track. These are live symbols pulled from TradingView.
2. Asset Quantities
Fields: Asset 1 Amount, Asset 2 Amount, …, Asset 15 Amount
What it means: How much of each asset you currently hold. For example:
• 0.03 BTC
• 2.1 ETH
Why it’s needed: The script multiplies this by the live price to calculate the current dollar value of each asset in your portfolio.
3. Target %
Fields: Asset 1 Implied %, Asset 2 Implied %, …, Asset 15 Implied %
What it means: Your desired allocation for each asset. For example:
• 40% BTC
• 20% ETH
• 10% SOL, etc.
Important: These must total 100% or less across all assets. The script checks this and shows an error if the total exceeds 100%.
The Dynamic Portfolio Tracker displays two powerful on-chart tables:
1. Main Table — Per Asset Breakdown
This table shows detailed, real-time information for each asset in your portfolio. Each row represents a different asset, and each column has a specific meaning:
Column What It Means
Asset = The symbol of the asset (e.g., BTCUSD, ETHUSD), auto-stripped from the exchange name.
Price = The current market price of the asset, pulled live from TradingView.
Quantity = How much of that asset you currently hold, entered manually in the inputs.
Target % = The percentage of your total portfolio you want this asset to represent.
Actual % = What percentage of your portfolio it currently makes up (based on price × quantity).
Target Value = How much (in $) this asset should be worth in your portfolio.
Actual Value = How much (in $) this asset is currently worth.
Instruction = Whether to Buy, Sell, or Hold to match your target allocation.
Value Change = The dollar amount you’d need to buy/sell to rebalance this asset.
Units to Trade = The number of asset units to buy/sell to reach the target value.
2. Portfolio Summary Table — Portfolio Totals
This smaller table appears in the top-right corner and summarizes your entire portfolio at a glance:
Target % = Total of all your assigned target allocations (should equal 100%).
Actual % = Actual portfolio composition (always 100% unless your capital is zero).
Target Value = Total value your portfolio should be based on your target percentages.
Actual Value = Current live total value of your portfolio.
If there’s a discrepancy between Target Value and Actual Value, the difference is shown in each row of the main table, so you can adjust individual assets accordingly.
Privacy First: Hide Sensitive Financial Data
A unique feature of this tool is the ability to hide sensitive financial data, such as:
• Target Value
• Actual Value
• Total Portfolio Value
You can turn these off using toggle settings, and they’ll be replaced with a crossed-out eye icon (👁️🗨️) — just like on modern crypto exchanges. This feature makes the script safe for streaming, screenshots, or sharing publicly while protecting your privacy.
But more importantly:
Feelings are the enemy of good investing.
Seeing the value of your portfolio fluctuate can trigger fear or greed. By hiding your dollar values, you’re not just securing your data — you’re reducing the temptation to react emotionally.
It’s just numbers. Systems over Feelings.
Table Automatically Adapts to Your Asset Count
The Dynamic Portfolio Tracker is designed to scale with your portfolio. Simply choose how many assets you want to track (up to 15), and the table will automatically resize to fit exactly that number — no wasted space or empty rows.
• Select 1 to 15 assets using the “Number of Assets” input
• The table expands or contracts dynamically to show only those rows
• All calculations, summaries, and layout elements adjust accordingly in real time
This keeps the interface clean, focused, and perfectly tailored to your setup — whether you’re tracking 3 coins or managing a full portfolio of 12+ tokens.
Customize Your Table to Match Your Style
The Dynamic Portfolio Tracker offers a full suite of visual customization options, allowing you to tailor the table to your charting style or stream layout. You can:
• Choose text colors for labels, values, and headers
• Set background colors for the full table and header row — or turn them off completely for a clean, transparent look
• Control border and frame settings, including color, thickness, or disabling them entirely
• Pick custom colors for Buy and Sell signals in the rebalance column
• Adjust table font size from tiny to large to match your resolution or preferences
Special Thanks
This tool wouldn’t exist without the knowledge and inspiration gained through The Real World. A sincere thank you to the Investing Master, the Guides, and Professor Adam — your frameworks and lessons brought clarity, discipline, and structure to this build.
And of course, glory to L4 — where real men are made.
Skrip sumber terbuka
Dalam semangat TradingView sebenar, pencipta skrip ini telah menjadikannya sumber terbuka, jadi pedagang boleh menilai dan mengesahkan kefungsiannya. Terima kasih kepada penulis! Walaupuan anda boleh menggunakan secara percuma, ingat bahawa penerbitan semula kod ini tertakluk kepada Peraturan Dalaman.
Penafian
Maklumat dan penerbitan adalah tidak bertujuan, dan tidak membentuk, nasihat atau cadangan kewangan, pelaburan, dagangan atau jenis lain yang diberikan atau disahkan oleh TradingView. Baca lebih dalam Terma Penggunaan.