OPEN-SOURCE SCRIPT
Latent Regime Informed Monte Carlo Forecast
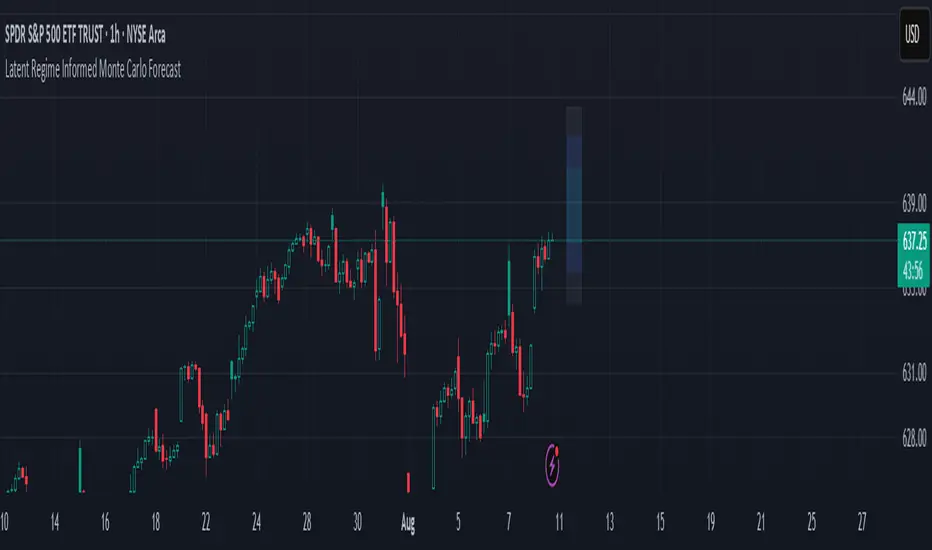
This script uses a Monte Carlo simulation to forecast where price might be a set number of bars into the future (default 6 bars ahead). It generates hundreds of possible future price paths based on an average move (drift) and random shocks (volatility). The result is a distribution of outcomes, displayed as probability zones: the median (most likely), inner bands (50% confidence), and wider bands (80% and 95% confidence). Due to the randomness assumption in Monte Carlo simulations, the paths are not very important so to minimize cluttering on the graphs we only plot bands. These zones help you visualize uncertainty, set stops and targets based on probabilities, and spot when market behavior changes.
The accuracy of any Monte Carlo forecast depends heavily on how well you estimate trend and volatility. By default and no prior information the Monte Carlo simulation gives you a parabolic forecast that assumes absolute randomness. This is where the Kalman filter comes in. The filter (derived from control theory) aims to detect latent (unobservable) traits about the system by continuously updating its transition probabilities to better understand how the latent traits affect the observable measurement (price). With each new observable state we get better and better transition probabilities and enhances our understanding about the latent and unobservable market characteristics like trend and volatility. Both crucial measurements for short term market sentiment.
Extracting these measurements for market sentiment informs us how to better parametrize the Monte Carlo simulation for a better forecast. Each bar, the KF updates its estimates based on how close its last prediction was to reality. In calm periods, it holds estimates steady; in volatile periods, it adapts quickly. This gives you real-time, low-lag measurements of both trend and volatility.
By feeding these adaptive estimates into the Monte Carlo simulation, the forecast becomes much more responsive to current market conditions. In trends, the predicted paths tilt toward the direction of movement; in choppy markets, they spread wider but stay centered; when volatility spikes, the probability zones expand immediately. The result is a dynamic forecast tool that adjusts on every bar, giving you a clearer, probability-based picture of where the market could go next.
This is my very first script and I would love feedback/ideas for different topics.
My background is in economics/mathematics and interests lie in time series analysis/exploring financial features for DS
Skrip sumber terbuka
Dalam semangat TradingView sebenar, pencipta skrip ini telah menjadikannya sumber terbuka, jadi pedagang boleh menilai dan mengesahkan kefungsiannya. Terima kasih kepada penulis! Walaupuan anda boleh menggunakan secara percuma, ingat bahawa penerbitan semula kod ini tertakluk kepada Peraturan Dalaman.
Penafian
Maklumat dan penerbitan adalah tidak bertujuan, dan tidak membentuk, nasihat atau cadangan kewangan, pelaburan, dagangan atau jenis lain yang diberikan atau disahkan oleh TradingView. Baca lebih dalam Terma Penggunaan.