OPEN-SOURCE SCRIPT
SDSpike
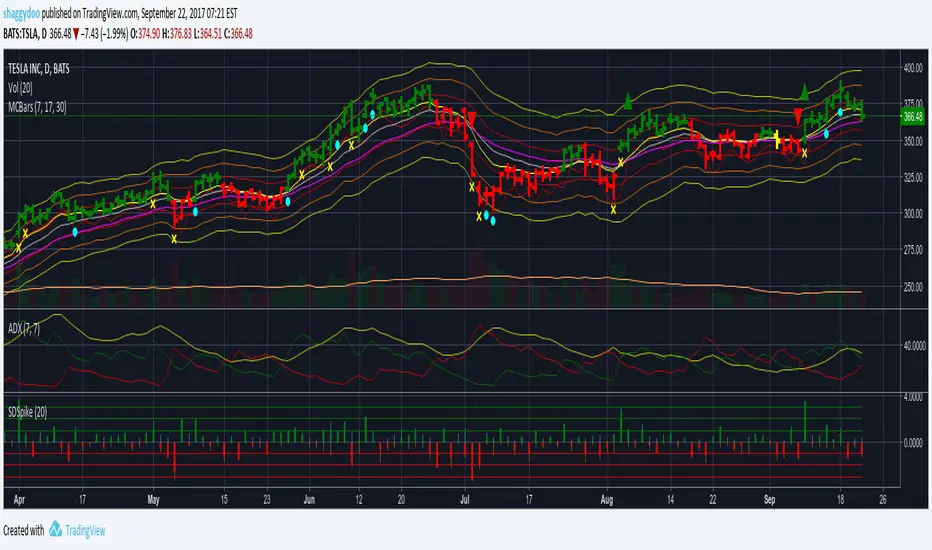
Price Change as Standard Deviation Spikes
Plots price changes scaled to daily StdDev for the period
The Close price change is plotted as a thick bar coloured green for up close, red for down close
The High price change is plotted as a thin bar coloured aqua
The Low price change is plotted as a thin bar coloured orange
Can be used to understand the statistical price behaviour of the symbol.
Very useful for earnings trades and in general for options trades.
Skrip sumber terbuka
Dalam semangat TradingView sebenar, pencipta skrip ini telah menjadikannya sumber terbuka, jadi pedagang boleh menilai dan mengesahkan kefungsiannya. Terima kasih kepada penulis! Walaupuan anda boleh menggunakan secara percuma, ingat bahawa penerbitan semula kod ini tertakluk kepada Peraturan Dalaman.
Penafian
Maklumat dan penerbitan adalah tidak bertujuan, dan tidak membentuk, nasihat atau cadangan kewangan, pelaburan, dagangan atau jenis lain yang diberikan atau disahkan oleh TradingView. Baca lebih dalam Terma Penggunaan.