OPEN-SOURCE SCRIPT
Comprehensive Market Overview
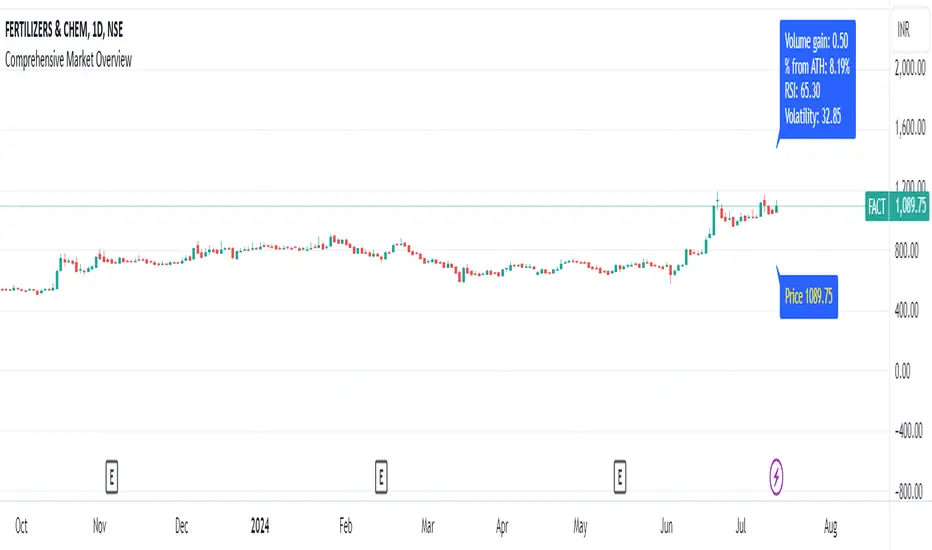
1. What is this indicator about?
The "Comprehensive Market Overview" indicator provides a holistic view of the market by incorporating several key metrics:
Close Price: Displays the current close price below each candle.
Percent from All-Time High: Calculates how far the current close price is from the highest high observed over a specified period.
RSI (Relative Strength Index): Measures the momentum of price movements to assess whether a stock is overbought or oversold.
Volume Gain: Computes the current volume relative to its 20-period simple moving average (SMA), indicating volume strength or weakness.
Volatility: Quantifies market volatility by calculating the ratio of the Bollinger Bands' width (difference between upper and lower bands) to the SMA.
2. How it works?
Close Price Label: This label is displayed below each bar, showing the current close price.
Percent from All-Time High: Calculates the percentage difference between the highest high observed (all-time high) and the current close price.
RSI Calculation: Computes the RSI using a 14-period setting, providing insight into whether a stock is potentially overbought or oversold.
Volume Strength: Computes the current volume divided by its 20-period SMA, indicating whether volume is above or below average.
Volatility Calculation: Calculates the width of the Bollinger Bands (based on a 20-period SMA and 2 standard deviations) and expresses it as a percentage of the SMA, providing a measure of market volatility
3.Correct Trend Identification with Indicators
All-Time High (ATH) Levels:
Low Value (Near ATH): When the percent from ATH is low (close to 0%), it indicates that the current price is near the all-time high zone. This suggests strong bullish momentum and potential resistance levels.
High Value (Below ATH): A high percentage from ATH indicates how much the current price is below the all-time high. This could signal potential support levels or opportunities for price recovery towards previous highs.
RSI (Relative Strength Index):
Overbought (High RSI): RSI values above 70 typically indicate that the asset is overbought, suggesting a potential reversal or correction in price.
Oversold (Low RSI): RSI values below 30 indicate oversold conditions, suggesting a potential rebound or price increase.
Swing Trading Strategies
Confirmation with Visual Analysis: Visualizing the chart to confirm ATH levels and RSI readings can provide strong indications of market sentiment and potential trading opportunities:
Bullish Signals: Look for prices near ATH with RSI confirming strength (not yet overbought), indicating potential continuation or breakout.
Bearish Signals: Prices significantly below ATH with RSI showing weakness (not yet oversold), indicating potential for a bounce or reversal.
Volume Confirmation: Comparing current volume to its SMA helps confirm the strength of price movements. Higher current volume relative to the SMA suggests strong price action.
Volatility Assessment: Monitoring volatility through the Bollinger Bands' width ratio helps assess potential price swings. Narrow bands suggest low volatility, while wide bands indicate higher volatility and potential trading opportunities.
4.Entry and Exit Points:
Entry: Consider entering long positions near support levels when prices are below ATH and RSI is oversold. Conversely, enter short positions near resistance levels when prices are near ATH and RSI is overbought.
Exit: Exit long positions near resistance or ATH levels when prices show signs of resistance or RSI becomes overbought. Exit short positions near support levels or when prices rebound from oversold conditions.
Risk Management: Always incorporate risk management techniques such as setting stop-loss orders based on support and resistance levels identified through ATH and RSI analysis.
Implementation Example
Skrip sumber terbuka
Dalam semangat TradingView sebenar, pencipta skrip ini telah menjadikannya sumber terbuka, jadi pedagang boleh menilai dan mengesahkan kefungsiannya. Terima kasih kepada penulis! Walaupuan anda boleh menggunakan secara percuma, ingat bahawa penerbitan semula kod ini tertakluk kepada Peraturan Dalaman.
Penafian
Maklumat dan penerbitan adalah tidak bertujuan, dan tidak membentuk, nasihat atau cadangan kewangan, pelaburan, dagangan atau jenis lain yang diberikan atau disahkan oleh TradingView. Baca lebih dalam Terma Penggunaan.