OPEN-SOURCE SCRIPT
Stochastic Ribbon & EMAs
Here's a comprehensive description for publishing your indicator:
---
# **Stochastic Ribbon & EMAs**
A clean and powerful trading indicator that combines **Stochastic Support/Resistance levels** with **Essential Moving Averages** for comprehensive market analysis.
## **📊 What It Does**
This indicator provides **7 key reference lines** on your chart:
- **3 Stochastic levels** (20%, 50%, 80%) - Dynamic support/resistance zones
- **4 Essential EMAs** (20, 50, 100, 200) - Trend direction and momentum
## **🎯 Key Features**
### **Stochastic Ribbon (3 Yellow Lines)**
- **80% Line**: Dynamic resistance level - potential selling zone
- **50% Line**: Market equilibrium - trend direction reference
- **20% Line**: Dynamic support level - potential buying zone
- **Default 50-period lookback** for stable, reliable levels
- **All lines in yellow** for clean, consistent visualization
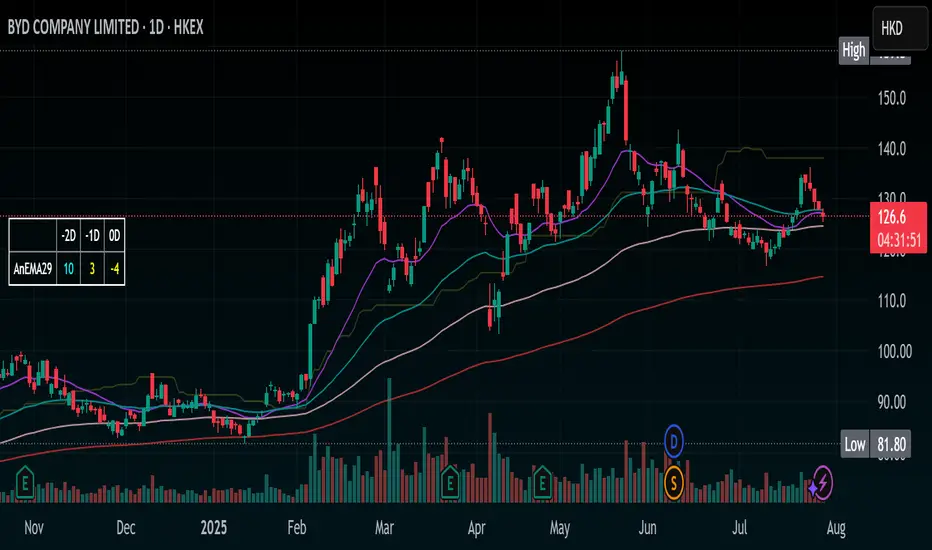
### **Essential EMAs (4 Colored Lines)**
- **20 EMA** (Purple): Short-term trend and entry timing
- **50 EMA** (Dark Cyan): Medium-term trend direction
- **100 EMA** (Rosy Brown): Long-term trend confirmation
- **200 EMA** (Brown): Major trend and institutional levels
## **📈 How to Use**
### **For Support & Resistance:**
- **Above 80% line**: Look for selling opportunities (overbought zone)
- **Between 50-80%**: Bullish bias, pullbacks to 50% line for entries
- **Around 50% line**: Key equilibrium - watch for direction
- **Between 20-50%**: Bearish bias, bounces to 50% line for exits
- **Below 20% line**: Look for buying opportunities (oversold zone)
### **For Trend Analysis:**
- **EMA Stack Order**: Higher timeframe EMAs above lower = uptrend
- **Price above all EMAs**: Strong bullish momentum
- **Price below all EMAs**: Strong bearish momentum
- **EMA as dynamic support/resistance**: Bounces and rejections
### **For Entry Signals:**
- **Confluence zones**: Where Stochastic levels meet EMA levels
- **Breakouts**: Price breaking through multiple levels simultaneously
- **Reversals**: Price rejection at extreme Stochastic levels with EMA confirmation
## **⚙️ Settings**
### **Stochastic Ribbon**
- **Show/Hide**: Toggle the 3 Stochastic lines
- **Length**: Period for high/low calculation (default: 50)
- **Start**: Multiplier for calculation (default: 1)
### **EMAs**
- **Individual toggles**: Show/hide each EMA separately
- **Custom periods**: Adjust each EMA length (defaults: 20, 50, 100, 200)
- **Custom colors**: Personalize each EMA color
## **🚀 Why This Indicator?**
✅ **Clean & Simple**: No cluttered charts - just essential levels
✅ **Multi-Timeframe**: Works on all timeframes from 1m to 1W
✅ **Versatile**: Suitable for scalping, day trading, and swing trading
✅ **Low Lag**: Dynamic levels that adapt to current market conditions
✅ **Proven Components**: Combines two well-established technical concepts
✅ **Customizable**: Adjust all parameters to fit your trading style
## **💡 Pro Tips**
- **Use multiple timeframes**: Check higher timeframe alignment for stronger signals
- **Combine with volume**: Look for volume confirmation at key levels
- **Watch for confluences**: Best signals occur where multiple levels align
- **Respect the 50% line**: Often acts as the most important level for trend direction
## **📋 Technical Details**
- **Version**: Pine Script v5
- **Overlay**: Yes (displays on main price chart)
- **Plots**: 7 total (well within Pine Script limits)
- **Performance**: Optimized for fast loading and smooth operation
---
**Perfect for traders who want clear, actionable levels without chart clutter. Whether you're a beginner learning support/resistance or an experienced trader looking for clean reference points, this indicator delivers exactly what you need.**
---
# **Stochastic Ribbon & EMAs**
A clean and powerful trading indicator that combines **Stochastic Support/Resistance levels** with **Essential Moving Averages** for comprehensive market analysis.
## **📊 What It Does**
This indicator provides **7 key reference lines** on your chart:
- **3 Stochastic levels** (20%, 50%, 80%) - Dynamic support/resistance zones
- **4 Essential EMAs** (20, 50, 100, 200) - Trend direction and momentum
## **🎯 Key Features**
### **Stochastic Ribbon (3 Yellow Lines)**
- **80% Line**: Dynamic resistance level - potential selling zone
- **50% Line**: Market equilibrium - trend direction reference
- **20% Line**: Dynamic support level - potential buying zone
- **Default 50-period lookback** for stable, reliable levels
- **All lines in yellow** for clean, consistent visualization
### **Essential EMAs (4 Colored Lines)**
- **20 EMA** (Purple): Short-term trend and entry timing
- **50 EMA** (Dark Cyan): Medium-term trend direction
- **100 EMA** (Rosy Brown): Long-term trend confirmation
- **200 EMA** (Brown): Major trend and institutional levels
## **📈 How to Use**
### **For Support & Resistance:**
- **Above 80% line**: Look for selling opportunities (overbought zone)
- **Between 50-80%**: Bullish bias, pullbacks to 50% line for entries
- **Around 50% line**: Key equilibrium - watch for direction
- **Between 20-50%**: Bearish bias, bounces to 50% line for exits
- **Below 20% line**: Look for buying opportunities (oversold zone)
### **For Trend Analysis:**
- **EMA Stack Order**: Higher timeframe EMAs above lower = uptrend
- **Price above all EMAs**: Strong bullish momentum
- **Price below all EMAs**: Strong bearish momentum
- **EMA as dynamic support/resistance**: Bounces and rejections
### **For Entry Signals:**
- **Confluence zones**: Where Stochastic levels meet EMA levels
- **Breakouts**: Price breaking through multiple levels simultaneously
- **Reversals**: Price rejection at extreme Stochastic levels with EMA confirmation
## **⚙️ Settings**
### **Stochastic Ribbon**
- **Show/Hide**: Toggle the 3 Stochastic lines
- **Length**: Period for high/low calculation (default: 50)
- **Start**: Multiplier for calculation (default: 1)
### **EMAs**
- **Individual toggles**: Show/hide each EMA separately
- **Custom periods**: Adjust each EMA length (defaults: 20, 50, 100, 200)
- **Custom colors**: Personalize each EMA color
## **🚀 Why This Indicator?**
✅ **Clean & Simple**: No cluttered charts - just essential levels
✅ **Multi-Timeframe**: Works on all timeframes from 1m to 1W
✅ **Versatile**: Suitable for scalping, day trading, and swing trading
✅ **Low Lag**: Dynamic levels that adapt to current market conditions
✅ **Proven Components**: Combines two well-established technical concepts
✅ **Customizable**: Adjust all parameters to fit your trading style
## **💡 Pro Tips**
- **Use multiple timeframes**: Check higher timeframe alignment for stronger signals
- **Combine with volume**: Look for volume confirmation at key levels
- **Watch for confluences**: Best signals occur where multiple levels align
- **Respect the 50% line**: Often acts as the most important level for trend direction
## **📋 Technical Details**
- **Version**: Pine Script v5
- **Overlay**: Yes (displays on main price chart)
- **Plots**: 7 total (well within Pine Script limits)
- **Performance**: Optimized for fast loading and smooth operation
---
**Perfect for traders who want clear, actionable levels without chart clutter. Whether you're a beginner learning support/resistance or an experienced trader looking for clean reference points, this indicator delivers exactly what you need.**
Skrip sumber terbuka
Dalam semangat TradingView sebenar, pencipta skrip ini telah menjadikannya sumber terbuka, jadi pedagang boleh menilai dan mengesahkan kefungsiannya. Terima kasih kepada penulis! Walaupuan anda boleh menggunakan secara percuma, ingat bahawa penerbitan semula kod ini tertakluk kepada Peraturan Dalaman.
Penafian
Maklumat dan penerbitan adalah tidak bertujuan, dan tidak membentuk, nasihat atau cadangan kewangan, pelaburan, dagangan atau jenis lain yang diberikan atau disahkan oleh TradingView. Baca lebih dalam Terma Penggunaan.