OPEN-SOURCE SCRIPT
Green Line Breakout (GLB) - Public Use
NOTE: This is public use - open source version of GLB published by me in Sep 2020. As Trading View is not allow unprotect script already shared, I am sharing it for anyone to use the script and make a copy.
========
This is an implementation of Green Line Breakout ( GLB ) which is popularized by Eric Wish through his Wishing Wealth Blog.
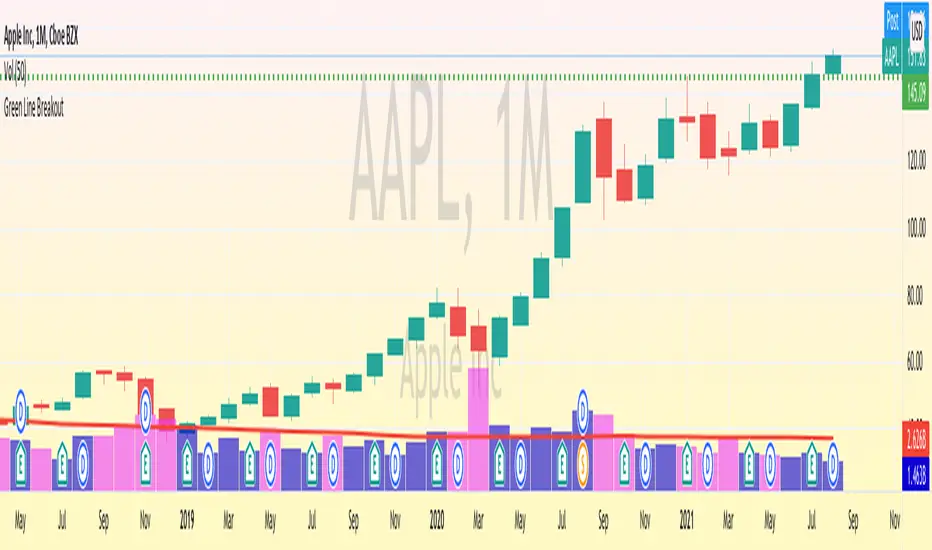
GLB indicator looks at a monthly chart for a stock that hit a new all time high recently and draw a green horizontal line at the highest price reached at any month, that has not been surpassed for at least 3 months.
In other words, this method finds stock that reached an all-time high and has then rested for at least three months. When a stock moves through the green line or is above its last green line, it is an indication of strong buying interest.
Read more about how to use the indicator in Wishing Wealth Blog.
Usage Explanation:
1. Set the time frame to Monthly for a stock and automatically a green dashed line appears based on the calculation explained above
2. If no GLB found for a stock, then green line appears at 0.0
2. If you set any other time frame other than Monthly, no Green Dashed line shown
========
This is an implementation of Green Line Breakout ( GLB ) which is popularized by Eric Wish through his Wishing Wealth Blog.
GLB indicator looks at a monthly chart for a stock that hit a new all time high recently and draw a green horizontal line at the highest price reached at any month, that has not been surpassed for at least 3 months.
In other words, this method finds stock that reached an all-time high and has then rested for at least three months. When a stock moves through the green line or is above its last green line, it is an indication of strong buying interest.
Read more about how to use the indicator in Wishing Wealth Blog.
Usage Explanation:
1. Set the time frame to Monthly for a stock and automatically a green dashed line appears based on the calculation explained above
2. If no GLB found for a stock, then green line appears at 0.0
2. If you set any other time frame other than Monthly, no Green Dashed line shown
Skrip sumber terbuka
Dalam semangat TradingView sebenar, pencipta skrip ini telah menjadikannya sumber terbuka, jadi pedagang boleh menilai dan mengesahkan kefungsiannya. Terima kasih kepada penulis! Walaupuan anda boleh menggunakan secara percuma, ingat bahawa penerbitan semula kod ini tertakluk kepada Peraturan Dalaman.
Penafian
Maklumat dan penerbitan adalah tidak bertujuan, dan tidak membentuk, nasihat atau cadangan kewangan, pelaburan, dagangan atau jenis lain yang diberikan atau disahkan oleh TradingView. Baca lebih dalam Terma Penggunaan.