PROTECTED SOURCE SCRIPT
Arbitrage System

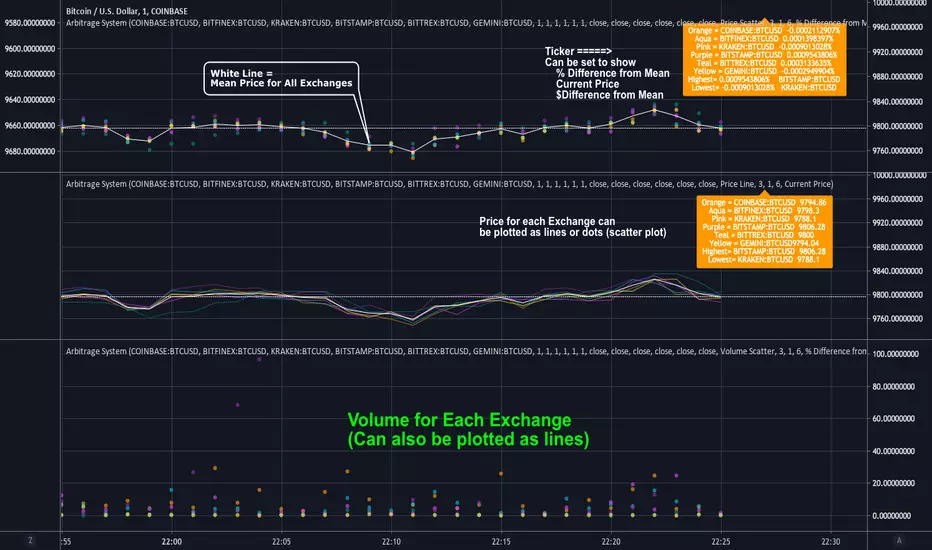
This script allows you to track the price and volume movement across 6 different exchanges. By default, it is configured for BTC and pulls price and volume data from Gemini, Bitfinex, Bittrex, Bitstamp, Coinbase and Kraken.
Users can use the input options menu to choose which exchanges or symbol is used. It has 4 different modes:
1.Price Scatter: Plots the prices from each exchange around one center white line that represents the mean price across all 6 exchanges.
2. Price Line: Same thing as above, except lines are used instead of circles.
3. Volume Scatter: Plots the volumes for each exchange as colored circles, similar to a scatter plot.
4. Volume Line: Same as above except lines are used instead of circles.
The label in the top right corner displays the current price for each exchange. This can be configured in the input menu and can display
-Current Price
-% Difference from Mean
-$ Difference from Mean
This label also displays the highest and lowest price (or % diff) amongst the 6 exchanges.
Prices are pulled in 1 minute intervals, but the mean price line(white) can be adjusted to show 5, 15, 30, 1 hour or 2 hour avg price across all 6 exchanges.
Skrip dilindungi
Skrip ini diterbitkan sebagai sumber tertutup. Akan tetapi, anda boleh menggunakannya secara bebas dan tanpa apa-apa had – ketahui lebih di sini.
-Profit Programmers
profitprogrammer.com
profitprogrammer.com
Penafian
Maklumat dan penerbitan adalah tidak bertujuan, dan tidak membentuk, nasihat atau cadangan kewangan, pelaburan, dagangan atau jenis lain yang diberikan atau disahkan oleh TradingView. Baca lebih dalam Terma Penggunaan.