OPEN-SOURCE SCRIPT
Telah dikemas kini [blackcat] L3 Market Pulse Insight
OVERVIEW
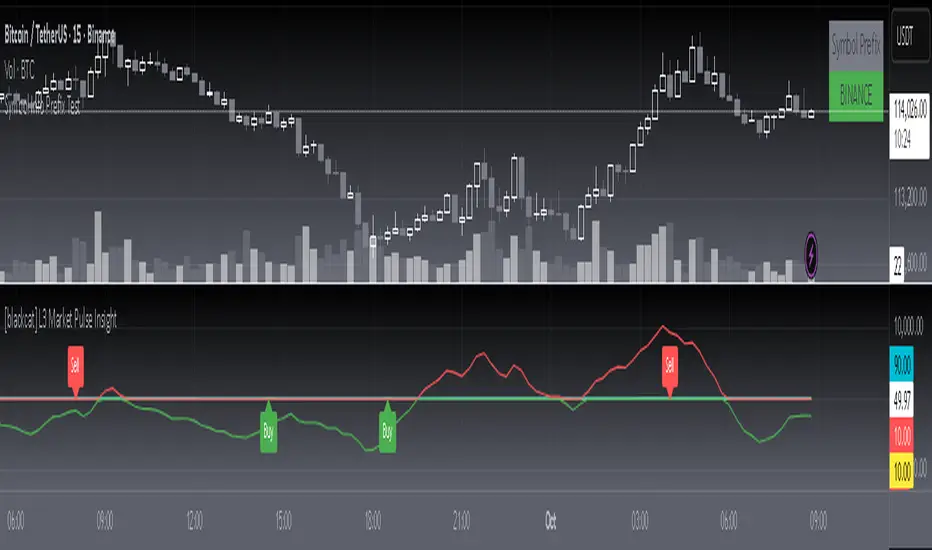
The [blackcat] L3 Market Pulse Insight provides comprehensive analytics by evaluating key price metrics to reveal critical market sentiment and potential trade opportunities 📊🔍. This advanced indicator leverages proprietary calculations involving Simple Moving Averages (SMAs), Exponential Moving Averages (EMAs), and custom thresholds to deliver detailed insights into current market dynamics 🚀✨.
By plotting various lines representing core fundamentals and directional cues, traders gain visibility into underlying trends and shifts within the market pulse. The visual aids simplify complex data interpretation, making it easier for users to make strategic decisions based on clear, actionable information ✅⛈️.
FEATURES
Advanced Calculation Techniques:
Employs sophisticated formulas integrating SMAs and EMAs for precise trend analysis.
Incorporates fundamental lines and confirmations based on recent price extremes.
Comprehensive Visualization:
Plots multiple informational lines: Fundamental Line, Thresholds, Institutional Directions, etc., each reflecting unique aspects of price behavior.
Uses distinct colors for easy differentiation between bearish and bullish indications.
Customizable Alerts:
Generates "Buy" and "Sell" labels at pivotal moments, highlighting entry/exit points visually.
Offers flexibility to modify alert styles and positions according to user preferences.
Dynamic Adaptability:
Continuously updates plots and alerts based on incoming real-time data for timely responses.
Provides dynamic support/resistance levels adapting to evolving market conditions.
HOW TO USE
Installing the Indicator:
To start using the [blackcat] L3 Market Pulse Insight, add it via the Pine Editor on TradingView:
Open the editor from the bottom panel.
Copy-paste the provided script code.
Click “Add to Chart” after pasting.
Understanding Key Lines:
Familiarize yourself with what each plotted line signifies:
Fundamental Line: Represents core price movements adjusted through SMA transformations.
Low Confirmation & Warnings: Provide early signals about potential reversals or continuation scenarios.
Threshold B: Acts as a significant barrier indicating overbought/sold conditions.
Institutional Directions: Offer insights into larger player activities and intentions.
Interpreting Signals:
Pay close attention to generated "Buy" and "Sell" labels appearing directly on your chart:
"Buy" Label: Indicates favorable momentum crossing from below the confirmation level upwards.
"Sell" Label: Suggests bearish transitions when moving beneath set thresholds.
Adjusting Parameters:
While this version primarily uses default settings derived from optimal testing ranges, feel free to experiment:
Modify lookback periods in SMA/EMA functions if different timeframes align better with your strategy.
Customize plot colors/styles for enhanced readability and personal taste.
Integrating with Other Tools:
Enhance the reliability of signals produced by combining them with complementary indicators like RSI, MACD, or volume profiles for thorough validation.
Continuous Monitoring:
Regularly review performance and refine strategies incorporating insights gathered from [blackcat] L3 Market Pulse Insight across varying markets and assets.
LIMITATIONS
Data Dependency: Performance heavily relies on accurate historical data without anomalies.
Market Conditions Variability: Effectiveness may vary during extreme volatility or thin liquidity environments.
Parameter Fine-Tuning: Optimal configuration might differ significantly across instruments; continuous adjustments are necessary.
No Guarantees: Like any tool, this doesn't ensure profits and should be part of a broader analytical framework.
NOTES
Ensure solid grounding in technical analysis principles before deploying solely upon these insights.
Utilize backtesting rigorously under diverse market cycles to assess robustness thoroughly.
Consider external factors such as economic reports, geopolitical events influencing asset prices beyond purely statistical models.
Maintain discipline adhering predefined risk management protocols regardless of signal strength displayed here.
THANKS
We appreciate every member's contributions who have engaged actively throughout our development journey, offering constructive feedback driving improvements continually 🙏. Together we strive toward creating ever-more robust tools empowering traders worldwide!
Nota Keluaran
change overlay from true to falseSkrip sumber terbuka
Dalam semangat TradingView sebenar, pencipta skrip ini telah menjadikannya sumber terbuka, jadi pedagang boleh menilai dan mengesahkan kefungsiannya. Terima kasih kepada penulis! Walaupuan anda boleh menggunakan secara percuma, ingat bahawa penerbitan semula kod ini tertakluk kepada Peraturan Dalaman.
Avoid losing contact!Don't miss out! The first and most important thing to do is to join my Discord chat now! Click here to start your adventure: discord.com/invite/ZTGpQJq 防止失联,请立即行动,加入本猫聊天群: discord.com/invite/ZTGpQJq
Penafian
Maklumat dan penerbitan adalah tidak bertujuan, dan tidak membentuk, nasihat atau cadangan kewangan, pelaburan, dagangan atau jenis lain yang diberikan atau disahkan oleh TradingView. Baca lebih dalam Terma Penggunaan.
Skrip sumber terbuka
Dalam semangat TradingView sebenar, pencipta skrip ini telah menjadikannya sumber terbuka, jadi pedagang boleh menilai dan mengesahkan kefungsiannya. Terima kasih kepada penulis! Walaupuan anda boleh menggunakan secara percuma, ingat bahawa penerbitan semula kod ini tertakluk kepada Peraturan Dalaman.
Avoid losing contact!Don't miss out! The first and most important thing to do is to join my Discord chat now! Click here to start your adventure: discord.com/invite/ZTGpQJq 防止失联,请立即行动,加入本猫聊天群: discord.com/invite/ZTGpQJq
Penafian
Maklumat dan penerbitan adalah tidak bertujuan, dan tidak membentuk, nasihat atau cadangan kewangan, pelaburan, dagangan atau jenis lain yang diberikan atau disahkan oleh TradingView. Baca lebih dalam Terma Penggunaan.