OPEN-SOURCE SCRIPT
Telah dikemas kini Urika Trend Strength
The Urika Directional Strength (UDS) indicator calculates and visualizes the strength of the directional trend in the price data. It helps traders see the strength and direction of the trend and allows them to make informed trading decisions based on trend changes.
Calculation:
The Simple Moving Average is used to determine the upper and lower directional bands by adding and subtracting the product of the standard deviation of the price data and the multiplier of the moving average.
Direction: The upward directional trend and downward directional trend are calculated by taking the absolute value of the difference between the price data and the upper and lower directional bands, divided by the product of the standard deviation and the multiplier.
Strength: It is calculated by taking the absolute value of the difference between the price data and the moving average, divided by the product of the standard deviation and the multiplier.
Interpretation:
Direction: The position of the long and short lines at the top indicates the direction of the ticker. Long line for long position and Short line for short position.
Strength: When the Strength line is below the directional lines, it is a weak trend or consolidating. If it stays in between the two directional lines, it is a strong trend.
Nota Keluaran
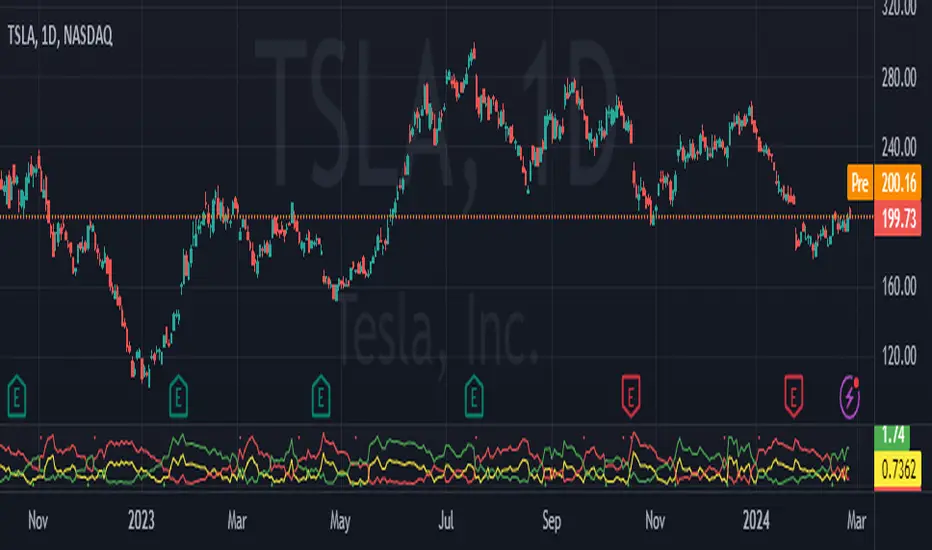
The Urika Trend Strength (UTS) indicator calculates and visualizes the strength of the directional trend in the price data. It helps traders see the strength and direction of the trend and allows them to make informed trading decisions based on trend changes.Calculation:
The Simple Moving Average is used to determine the upper and lower directional bands by adding and subtracting the product of the standard deviation of the price data and the multiplier of the moving average.
Direction: The upward directional trend and downward directional trend are calculated by taking the absolute value of the difference between the price data and the upper and lower directional bands, divided by the product of the standard deviation and the multiplier.
Strength: It is calculated by taking the absolute value of the difference between the price data and the moving average, divided by the product of the standard deviation and the multiplier.
Interpretation:
Direction: The position of the long and short lines at the top indicates the direction of the ticker. Long line for long position and Short line for short position.
Strength: When the Strength line is below the directional lines, it is a weak trend or consolidating. If it stays in between the two directional lines, it is a strong trend.
Nota Keluaran
I updated the name in the description to reflect that with the code.Skrip sumber terbuka
Dalam semangat TradingView sebenar, pencipta skrip ini telah menjadikannya sumber terbuka, jadi pedagang boleh menilai dan mengesahkan kefungsiannya. Terima kasih kepada penulis! Walaupuan anda boleh menggunakan secara percuma, ingat bahawa penerbitan semula kod ini tertakluk kepada Peraturan Dalaman.
Penafian
Maklumat dan penerbitan adalah tidak bertujuan, dan tidak membentuk, nasihat atau cadangan kewangan, pelaburan, dagangan atau jenis lain yang diberikan atau disahkan oleh TradingView. Baca lebih dalam Terma Penggunaan.
Skrip sumber terbuka
Dalam semangat TradingView sebenar, pencipta skrip ini telah menjadikannya sumber terbuka, jadi pedagang boleh menilai dan mengesahkan kefungsiannya. Terima kasih kepada penulis! Walaupuan anda boleh menggunakan secara percuma, ingat bahawa penerbitan semula kod ini tertakluk kepada Peraturan Dalaman.
Penafian
Maklumat dan penerbitan adalah tidak bertujuan, dan tidak membentuk, nasihat atau cadangan kewangan, pelaburan, dagangan atau jenis lain yang diberikan atau disahkan oleh TradingView. Baca lebih dalam Terma Penggunaan.