OPEN-SOURCE SCRIPT
Telah dikemas kini Ultimate Relative Strength
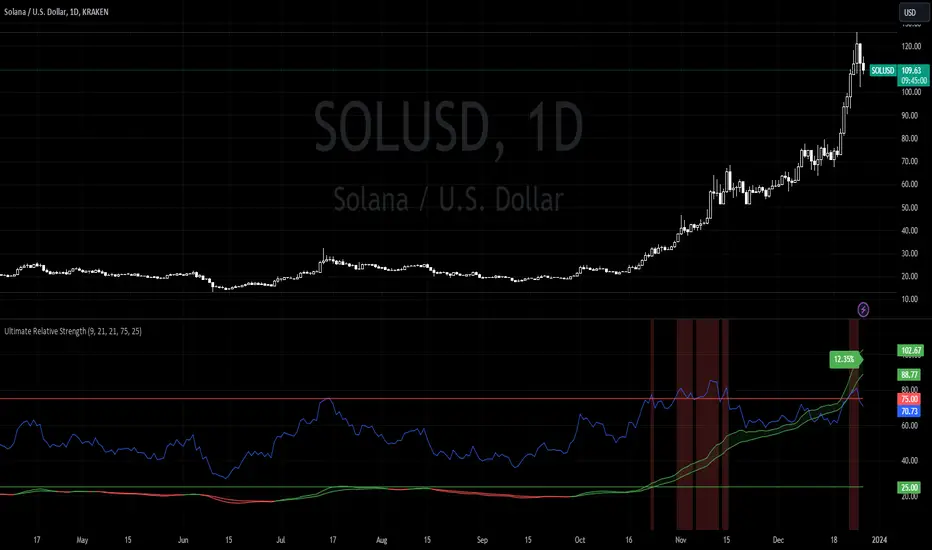
Ema 9 and 21 crossover bands. Green for positive trend, red for negative. It then calculates the distance between the bands and plots the distance as a percentage compared to the overall asset price.
Relative strength index with overbought and oversold levels (customizable). Green columns could be a good place to DCA. Red columns for marking local tops.
By recording the RS % amongst a list of assets, you can determine Salxx's RS Ranking from highest to lowest. A high ranking % inside a red column suggests short term dip or sideways movement. Not the best time to buy in. Monitor until consolidation between overbought and oversold levels. If RS ranking still high, now time to buy in.
Nota Keluaran
..Nota Keluaran
.Skrip sumber terbuka
Dalam semangat TradingView sebenar, pencipta skrip ini telah menjadikannya sumber terbuka, jadi pedagang boleh menilai dan mengesahkan kefungsiannya. Terima kasih kepada penulis! Walaupuan anda boleh menggunakan secara percuma, ingat bahawa penerbitan semula kod ini tertakluk kepada Peraturan Dalaman.
Penafian
Maklumat dan penerbitan adalah tidak bertujuan, dan tidak membentuk, nasihat atau cadangan kewangan, pelaburan, dagangan atau jenis lain yang diberikan atau disahkan oleh TradingView. Baca lebih dalam Terma Penggunaan.
Skrip sumber terbuka
Dalam semangat TradingView sebenar, pencipta skrip ini telah menjadikannya sumber terbuka, jadi pedagang boleh menilai dan mengesahkan kefungsiannya. Terima kasih kepada penulis! Walaupuan anda boleh menggunakan secara percuma, ingat bahawa penerbitan semula kod ini tertakluk kepada Peraturan Dalaman.
Penafian
Maklumat dan penerbitan adalah tidak bertujuan, dan tidak membentuk, nasihat atau cadangan kewangan, pelaburan, dagangan atau jenis lain yang diberikan atau disahkan oleh TradingView. Baca lebih dalam Terma Penggunaan.