OPEN-SOURCE SCRIPT
FCBI Brake Pressure
Brake Pressure (FCBI − USIRYY)
Concept
The Brake Pressure indicator quantifies whether the bond market is braking or releasing liquidity relative to real yields (USIRYY).
It is derived from the Financial-Conditions Brake Index (FCBI) and expresses the balance between long-term yield pressure and real-rate dynamics.
Formula
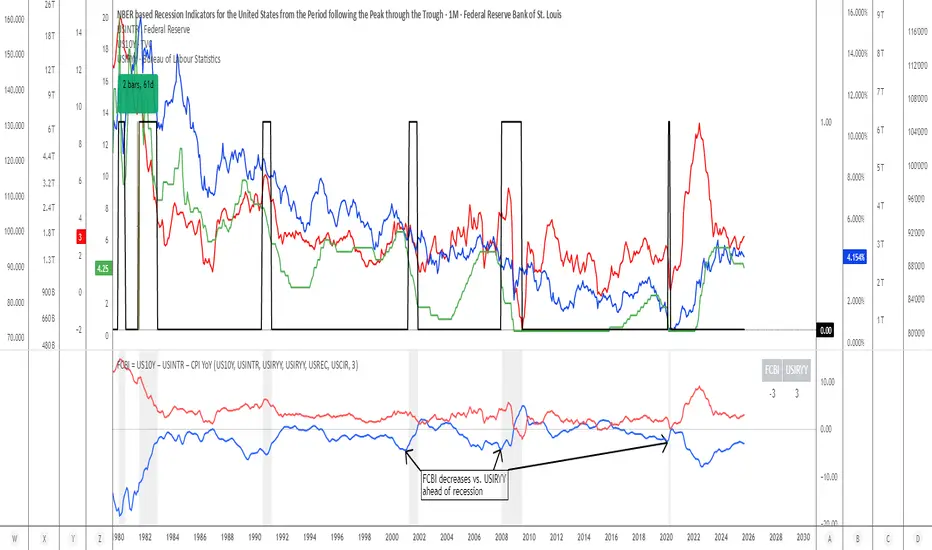
Brake Pressure = FCBI − USIRYY
where FCBI = (US10Y) − (USINTR) − (CPI YoY)
Purpose
While FCBI measures the intensity of financial-condition pressure, Brake Pressure shows when that brake is being applied or released.
It captures the turning point of liquidity transmission in the financial system.
How to Read
Brake Pressure < 0 (orange) → Brake engaged → financial conditions tighter than real-rate baseline; liquidity constrained.
Brake Pressure ≈ 0 → Neutral zone → transition phase between tightening and easing.
Brake Pressure > 0 (teal) → Brake released → financial conditions looser than real-rate baseline; liquidity flows freely → late-cycle setup before recession.
Zero-Cross Logic
Cross ↑ above 0 → FCBI > USIRYY → brake released → liquidity acceleration → typically 6–18 months before recession.
Cross ↓ below 0 → FCBI < USIRYY → brake re-engaged → tightening resumes.
Historical Behavior
Each major U.S. recession (2001, 2008, 2020) was preceded by a Brake Pressure cross above zero after a negative phase, signaling that long yields had stopped resisting Fed cuts and liquidity was expanding.
Practical Use
• Identify late-cycle turning points and liquidity inflection phases.
• Combine with FCBI for a complete macro transmission picture.
• Watch for sustained positive readings as early macro-recession warnings.
Current Example (Oct 2025)
FCBI ≈ −3.1, USIRYY ≈ +3.0 → Brake Pressure ≈ −6.1 → Brake still engaged. When this crosses above 0, it signals that liquidity is free flowing and the recession countdown has begun.
Summary
FCBI shows how tight the brake is. Brake Pressure shows when the brake releases.
When Brake Pressure > 0, the system has entered the liquidity-expansion phase that historically precedes a U.S. recession.
Concept
The Brake Pressure indicator quantifies whether the bond market is braking or releasing liquidity relative to real yields (USIRYY).
It is derived from the Financial-Conditions Brake Index (FCBI) and expresses the balance between long-term yield pressure and real-rate dynamics.
Formula
Brake Pressure = FCBI − USIRYY
where FCBI = (US10Y) − (USINTR) − (CPI YoY)
Purpose
While FCBI measures the intensity of financial-condition pressure, Brake Pressure shows when that brake is being applied or released.
It captures the turning point of liquidity transmission in the financial system.
How to Read
Brake Pressure < 0 (orange) → Brake engaged → financial conditions tighter than real-rate baseline; liquidity constrained.
Brake Pressure ≈ 0 → Neutral zone → transition phase between tightening and easing.
Brake Pressure > 0 (teal) → Brake released → financial conditions looser than real-rate baseline; liquidity flows freely → late-cycle setup before recession.
Zero-Cross Logic
Cross ↑ above 0 → FCBI > USIRYY → brake released → liquidity acceleration → typically 6–18 months before recession.
Cross ↓ below 0 → FCBI < USIRYY → brake re-engaged → tightening resumes.
Historical Behavior
Each major U.S. recession (2001, 2008, 2020) was preceded by a Brake Pressure cross above zero after a negative phase, signaling that long yields had stopped resisting Fed cuts and liquidity was expanding.
Practical Use
• Identify late-cycle turning points and liquidity inflection phases.
• Combine with FCBI for a complete macro transmission picture.
• Watch for sustained positive readings as early macro-recession warnings.
Current Example (Oct 2025)
FCBI ≈ −3.1, USIRYY ≈ +3.0 → Brake Pressure ≈ −6.1 → Brake still engaged. When this crosses above 0, it signals that liquidity is free flowing and the recession countdown has begun.
Summary
FCBI shows how tight the brake is. Brake Pressure shows when the brake releases.
When Brake Pressure > 0, the system has entered the liquidity-expansion phase that historically precedes a U.S. recession.
Skrip sumber terbuka
Dalam semangat TradingView sebenar, pencipta skrip ini telah menjadikannya sumber terbuka, jadi pedagang boleh menilai dan mengesahkan kefungsiannya. Terima kasih kepada penulis! Walaupuan anda boleh menggunakan secara percuma, ingat bahawa penerbitan semula kod ini tertakluk kepada Peraturan Dalaman.
Penafian
Maklumat dan penerbitan adalah tidak bertujuan, dan tidak membentuk, nasihat atau cadangan kewangan, pelaburan, dagangan atau jenis lain yang diberikan atau disahkan oleh TradingView. Baca lebih dalam Terma Penggunaan.