PROTECTED SOURCE SCRIPT
ChaosPulse Fractal Dimension Indicator
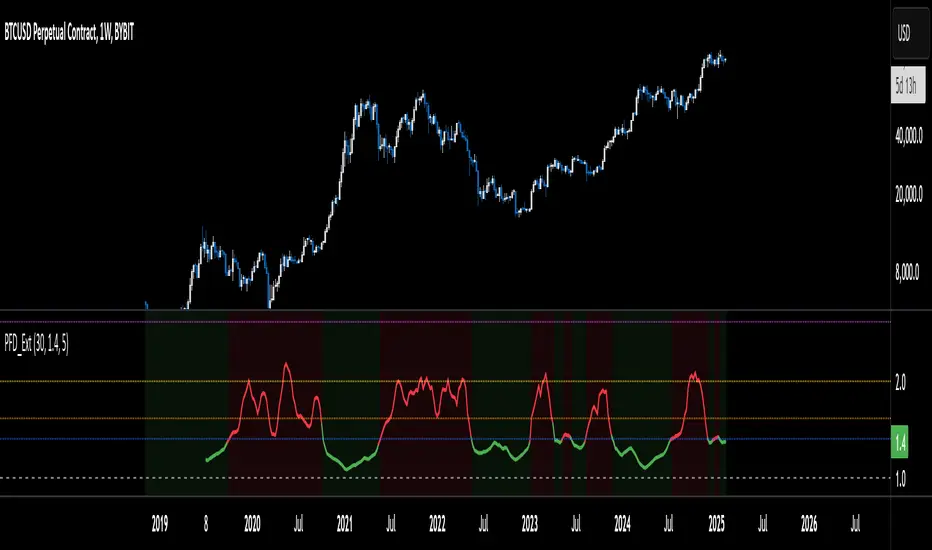
Overview:
The ChaosPulse Fractal Dimension Indicator is designed to measure the "complexity" or "chaos" of price movements over time. By calculating the fractal dimension of the price series, the indicator provides insights into whether the market is trending smoothly or exhibiting turbulent, potentially unpredictable behavior.
How It Works:
Fractal Dimension Calculation:
The indicator uses a fixed lookback window (default: 30 bars) to compute the fractal dimension. It does this by:
Summing the absolute differences between consecutive closing prices (the “path length”) within the window.
Measuring the direct distance between the current closing price and the closing price at the beginning of the window.
Calculating the fractal dimension using the formula:
FD
=
1
+
ln
(
sumDistances
/
𝑑
)
ln
(
window
−
1
)
FD=1+
ln(window−1)
ln(sumDistances/d)
This produces a value that indicates the degree of complexity in the price path.
Smoothing:
To filter out noise, the computed fractal dimension is smoothed using a simple moving average (SMA) over a configurable number of bars (default: 5).
Visual Cues:
The primary plot displays the smoothed fractal dimension. Its color changes based on whether the value is above or below a set threshold (default: 1.4), which is commonly interpreted as the point where market behavior transitions from smooth (closer to 1) to increasingly chaotic (approaching 2).
The indicator also draws several horizontal reference lines at key levels:
0.618
1.4 (default chaos threshold)
1.618 (the Golden Ratio)
2.0
2.618
These levels provide additional visual context. For instance, values near 1.618 might hint at a natural balance point, while higher values (closer to 2 or 2.618) suggest significant market turbulence.
The background color shifts (green for lower complexity, red for higher complexity) based on whether the smoothed fractal dimension exceeds the default threshold.
Interpreting the Values:
Fractal Dimension ≈ 1:
Indicates a smooth, nearly linear price movement—a trending or stable market.
Fractal Dimension Around 1.4:
Often used as a threshold, this level may signal the beginning of increased price complexity. When the indicator rises above 1.4, it might warn that the market is entering a more volatile, “chaotic” phase.
Fractal Dimension Near 1.618, 2.0, or 2.618:
These higher values suggest a significantly more complex, turbulent market. Such conditions could precede sharp price movements, reversals, or breakouts.
Fractal Dimension Around 0.618:
Represents extremely low complexity—suggesting a very calm market, potentially with little opportunity for dramatic changes.
Usage:
The ChaosPulse Fractal Dimension Indicator is not a standalone forecasting tool but rather a means to assess the “texture” of market movements. Traders can use it alongside other technical indicators to:
Identify periods of stability versus high volatility.
Gain additional insight into potential trend changes.
Adjust risk management strategies when the market enters a phase of increased complexity.
This description should help users understand both the theory behind the indicator and its practical application. The additional horizontal lines provide multiple reference points (including the intriguing 1.618 level, inspired by the Golden Ratio) to enhance the visual and analytical appeal of the tool.
Skrip dilindungi
Skrip ini diterbitkan sebagai sumber tertutup. Akan tetapi, anda boleh menggunakannya secara bebas dan tanpa apa-apa had – ketahui lebih di sini.
Penafian
Maklumat dan penerbitan adalah tidak bertujuan, dan tidak membentuk, nasihat atau cadangan kewangan, pelaburan, dagangan atau jenis lain yang diberikan atau disahkan oleh TradingView. Baca lebih dalam Terma Penggunaan.