OPEN-SOURCE SCRIPT
AnyTimeAndPrice

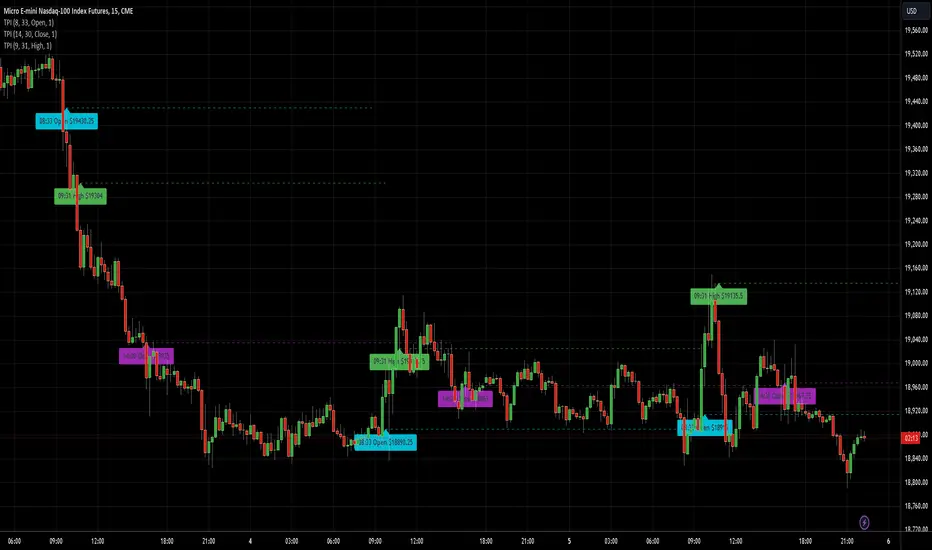
This indicator allows users to input a specific start time and display the price of a lower timeframe on a higher timeframe chart. It offers customization options for:
- Display name
- Label color
- Line extension
By adding multiple instances of the AnyTimeframeTimeAndPrice indicator, each customized for different times and prices, you can create a powerful and flexible tool for analyzing market data. Here's a potential setup:
1. Instance 1:
- Time: 08:23
- Price: Open
- Display Name: "8:23 Open"
- Label Color: Green
2. Instance 2:
- Time: 12:47
- Price: High
- Display Name: "12:47 High"
- Label Color: Red
3. Instance 3:
- Time: 15:19
- Price: Low
- Display Name: "3:19 Low"
- Label Color: Blue
4. Instance 4:
- Time: 16:53
- Price: Close
- Display Name: "4:53 Close"
- Label Color: Yellow
By having multiple instances, you can:
- Track different times and prices on the same chart
- Customize the display names, label colors, and line extensions for each instance
- Easily compare and analyze the relationships between different times and prices
This setup can be particularly useful for:
- Identifying key levels and support/resistance areas
- Analyzing market trends and patterns
- Making more informed trading decisions
Inputs:
1. AnyStartHour: Integer input for the start hour (default: 09, range: 0-23)
2. AnyStartMinute: Integer input for the start minute (default: 30, range: 0-59)
3. Sourcename: String input for the display name (default: "Open", options: "Open", "Close", "High", "Low")
4. Src_col: Color input for the label color (default: aqua)
5. linetimeExtMulti: Integer input for the line time extension (default: 1, range: 1-5)
Calculations:
1. AnyinputStartTime: Timestamp for the input start time
2. inputhour and inputminute: Hour and minute components of the input start time
3. formattedAnyTime: Formatted string for the input start time (HH:mm)
4. currenttime: Current timestamp
5. currenthour and currentminute: Hour and minute components of the current time
6. formattedTime: Formatted string for the current time (HH:mm)
7. onTime and okTime: Boolean flags for checking if the current time matches the input start time or is within the session
8. firstbartime: Timestamp for the first bar of the session
9. dailyminutesfromSource: Calculation for the daily minutes from the source
10. anyminSrcArray: Request security lower timeframe array for the source
11. ltf (lower timeframe): Integer variable for tracking the lower timeframe
12. Sourcevalue: Float variable for storing the source value
13. linetimeExt: Integer variable for line extension (calculated from linetimeExtMulti)
Logic:
1. Check if the current time matches the input start time or is within the session
2. If true, plot a line and label with the source value and formatted time
3. If not, check if the current time is within the daily session and plot a line and label accordingly
Notes:
- The script uses request.security_lower_tf to request data from a lower timeframe
- The script uses line.new and label.new to plot lines and labels on the chart
- The script uses str.format_time to format timestamps as strings (HH:mm)
- The script uses xloc.bar_time to position lines and labels at the bar time
This script allows users to input a specific start time and display the price of a lower timeframe on a higher timeframe chart, with options for customizing the display name, label color, and line extension.
Skrip sumber terbuka
Dalam semangat TradingView sebenar, pencipta skrip ini telah menjadikannya sumber terbuka, jadi pedagang boleh menilai dan mengesahkan kefungsiannya. Terima kasih kepada penulis! Walaupuan anda boleh menggunakan secara percuma, ingat bahawa penerbitan semula kod ini tertakluk kepada Peraturan Dalaman.
Penafian
Maklumat dan penerbitan adalah tidak bertujuan, dan tidak membentuk, nasihat atau cadangan kewangan, pelaburan, dagangan atau jenis lain yang diberikan atau disahkan oleh TradingView. Baca lebih dalam Terma Penggunaan.