PROTECTED SOURCE SCRIPT
Telah dikemas kini Fair Value Gap MTF [by Oberlunar]
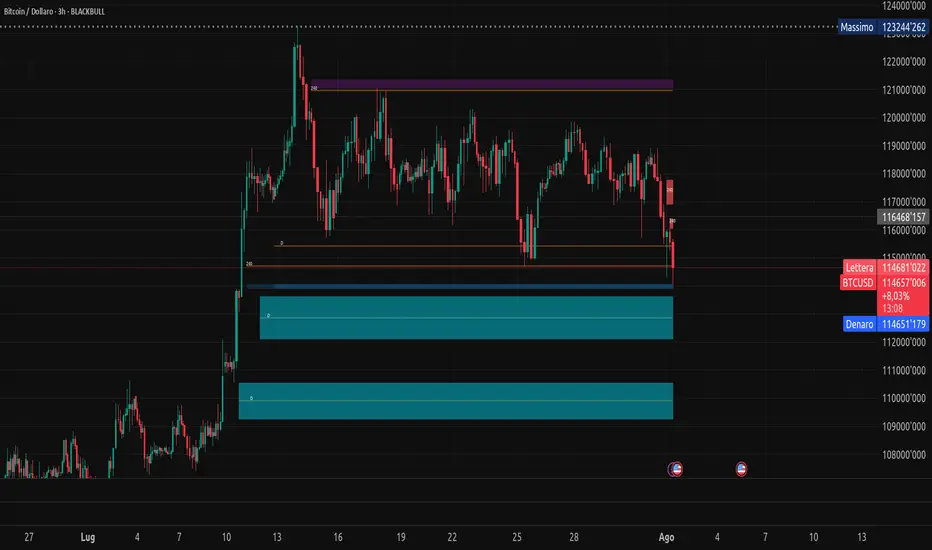
Fair Value Gap MTF [by Oberlunar] is a multi-timeframe indicator designed to detect and display Fair Value Gaps (FVGs) across up to five customizable timeframes. Fair Value Gaps are price inefficiencies—zones where the market moved too quickly, leaving unfilled areas between candles. These gaps are often used by traders as reference points for future price retracements, as they tend to be revisited or “mitigated” over time.
This indicator extends the traditional FVG concept by introducing dynamic multi-timeframe tracking. Each timeframe has its own visual layer, with distinct user-defined colors for bullish and bearish gaps. The script not only highlights newly formed FVGs but also updates them visually when they are touched by price. Mitigated FVGs are recolored in real time, and an optional setting allows the size of these zones to shrink progressively, reflecting only the remaining untested portion.
Labels at the center of each box display the originating timeframe, offering clear visual context. All calculations are properly aligned with the display chart, ensuring that each FVG is correctly projected into the current view, regardless of its timeframe of origin.
Fair Value Gaps often act as support or resistance levels. Bullish FVGs can serve as areas where price may find support, while bearish FVGs can signal potential resistance. When these zones are mitigated repeatedly, it typically reflects areas of institutional interest, liquidity pools, or zones of accumulation and distribution. Such behavior makes them particularly significant in breakout and reversal strategies.
— Oberlunar 👁️★
Nota Keluaran
Some bugfixes and community suggestions.Now, checkboxes are available to select specific timeframes,
and some noisy overlaps erased
Thanks for making the Oberlunar project great.
Nota Keluaran
additional bug fix... on the mitigation linesNota Keluaran
\Fair Value Gap MTF — Hidden “SB\_” signals for external use\This indicator exposes a set of \hidden plots\ (display=none) prefixed with \SB\_\ so other Pine scripts can subscribe to them via \[code]input.source()\[/code].
They provide FVG-derived \support/resistance levels\, a \mitigation state\, and \mitigation event pulses\ to build precise exits/entries.
\Pine version:\ v5 • \Plot budget:\ optimized to 64
\Why this exists\
Use these sources inside your own indicators/strategies without duplicating the whole FVG logic. You can read “nearest” levels by TF, composite nearest across TFs, and react on mitigation events with single-bar pulses.
\Naming convention (summary)\
\Per timeframe (TF1..TF5)\
* \Support (bullish)\:
\[code]SB\_FVG\_SUPPORT\_TOP\_TF#\[/code], \[code]SB\_FVG\_SUPPORT\_BOTTOM\_TF#\[/code], \[code]SB\_FVG\_SUPPORT\_MID\_TF#\[/code], \[code]SB\_FVG\_SUPPORT\_MIT\_TF#\[/code]
* \Resistance (bearish)\:
\[code]SB\_FVG\_RES\_TOP\_TF#\[/code], \[code]SB\_FVG\_RES\_BOTTOM\_TF#\[/code], \[code]SB\_FVG\_RES\_MID\_TF#\[/code], \[code]SB\_FVG\_RES\_MIT\_TF#\[/code]
* \Mitigation pulses (1 only on the event bar)\:
\[code]SB\_FVG\_SUPPORT\_MIT\_PULSE\_TF#\[/code], \[code]SB\_FVG\_RES\_MIT\_PULSE\_TF#\[/code]
\Composite (ALL) — picks the nearest level among all enabled TFs\
* \Support\: \[code]SB\_FVG\_SUPPORT\_TOP\_ALL\[/code], \[code]SB\_FVG\_SUPPORT\_BOTTOM\_ALL\[/code], \[code]SB\_FVG\_SUPPORT\_MIT\_ALL\[/code]
* \Resistance\: \[code]SB\_FVG\_RES\_TOP\_ALL\[/code], \[code]SB\_FVG\_RES\_BOTTOM\_ALL\[/code], \[code]SB\_FVG\_RES\_MIT\_ALL\[/code]
* \Mitigation pulses\: \[code]SB\_FVG\_SUPPORT\_MIT\_PULSE\_ALL\[/code], \[code]SB\_FVG\_RES\_MIT\_PULSE\_ALL\[/code]
* \Mitigation event prices (valid only on the pulse bar)\:
Support → \[code]SB\_FVG\_SUPPORT\_MIT\_PRICE\_ALL\[/code], \[code]SB\_FVG\_SUPPORT\_MIT\_TOP\_ALL\[/code], \[code]SB\_FVG\_SUPPORT\_MIT\_BOTTOM\_ALL\[/code]
Resistance → \[code]SB\_FVG\_RES\_MIT\_PRICE\_ALL\[/code], \[code]SB\_FVG\_RES\_MIT\_TOP\_ALL\[/code], \[code]SB\_FVG\_RES\_MIT\_BOTTOM\_ALL\[/code]
\Note:\ Composite \[code]MID\_ALL\[/code] is not exported (plot limit). Rebuild it as the average of TOP/BOTTOM.
\Operational definitions\
* \Nearest per TF\: for each TF, the exported level is the FVG \closest\ to current price on the coherent side
• Support = gap fully ≤ price (or containing price)
• Resistance = gap fully ≥ price (or containing price)
* \MIT flag\: \[code]0/1\[/code] whether that nearest FVG is \mitigated\.
* \Mitigation pulse\: a float \[code]0/1\[/code] series that equals 1 \only\ on the bar where an FVG turns from non-mitigated to mitigated.
* \Event prices\: on a pulse bar, composite series return \mid/top/bottom\ of the mitigated FVG chosen.
\How to consume these signals in your script\
1. In your indicator/strategy, add sources and select them from the dropdown (they appear as “IndicatorName — PlotName”).
2. Treat pulses as binary floats (0/1). For storing the event level, use \[code]ta.valuewhen()\[/code].
\[code]
//version=5
indicator("Consumer of FVG signals (demo)", overlay=true)
// Composite pulses
supPulseAll = input.source(title="SB\_FVG\_SUPPORT\_MIT\_PULSE\_ALL", defval=close)
resPulseAll = input.source(title="SB\_FVG\_RES\_MIT\_PULSE\_ALL", defval=close)
// Composite levels
supTopAll = input.source(title="SB\_FVG\_SUPPORT\_TOP\_ALL", defval=close)
supBotAll = input.source(title="SB\_FVG\_SUPPORT\_BOTTOM\_ALL", defval=close)
resTopAll = input.source(title="SB\_FVG\_RES\_TOP\_ALL", defval=close)
resBotAll = input.source(title="SB\_FVG\_RES\_BOTTOM\_ALL", defval=close)
// Rebuild composite MID if needed
supMidAll = math.avg(supTopAll, supBotAll)
resMidAll = math.avg(resTopAll, resBotAll)
// Event prices (valid on pulse bar)
supMitPriceAll = input.source(title="SB\_FVG\_SUPPORT\_MIT\_PRICE\_ALL", defval=close)
resMitPriceAll = input.source(title="SB\_FVG\_RES\_MIT\_PRICE\_ALL", defval=close)
// Example: exit long when a resistance FVG gets mitigated
exitLong = (resPulseAll == 1.0)
// Example: target at the last support mitigation event price
lastSupMitPrice = ta.valuewhen(supPulseAll == 1.0, supMitPriceAll, 0)
\[/code]
\Tips\
* The \[code]defval=close\[/code] in \[code]input.source()\[/code] is just a placeholder until you pick the real plot in the UI.
* Pulses are \single-bar\. Persist them with \[code]ta.valuewhen()\[/code] or your own state logic.
* For granular logic, combine per-TF pulses (\[code]...PULSE\_TF#\[/code]) with per-TF nearest levels (\[code]...TOP/BOTTOM/MID\_TF#\[/code], \[code]...MIT\_TF#\[/code]).
\Plot budget & customization\
* This set is capped at \64 plots\. If you need room for your own outputs, you can fork a “lean” variant (e.g., remove per-TF \[code]...MID\_TF#\[/code] or \[code]...MIT\_TF#\[/code] and keep only composite signals).
\Realtime / repaint note\
* Boxes update bar-by-bar. Pulses may appear intrabar; on bar close the state is stable.
* Consumers should account for intrabar changes if they act on realtime data.
\License & credits\
Please credit “Fair Value Gap MTF \[by Oberlunar]” when consuming these plots in public scripts.
Nota Keluaran
Following a community request, the script now offers colour and size personalisation of the labels.Skrip dilindungi
Skrip ini diterbitkan sebagai sumber tertutup. Akan tetapi, anda boleh menggunakannya secara bebas dan tanpa apa-apa had – ketahui lebih di sini.
Track my trades and access my automated signals (free):
t.me/oberlunar_btcusd
My community is free, but if you’re not present and
don’t interact, you’re out.
t.me/oberlunar_btcusd
My community is free, but if you’re not present and
don’t interact, you’re out.
Penafian
Maklumat dan penerbitan adalah tidak bertujuan, dan tidak membentuk, nasihat atau cadangan kewangan, pelaburan, dagangan atau jenis lain yang diberikan atau disahkan oleh TradingView. Baca lebih dalam Terma Penggunaan.
Skrip dilindungi
Skrip ini diterbitkan sebagai sumber tertutup. Akan tetapi, anda boleh menggunakannya secara bebas dan tanpa apa-apa had – ketahui lebih di sini.
Track my trades and access my automated signals (free):
t.me/oberlunar_btcusd
My community is free, but if you’re not present and
don’t interact, you’re out.
t.me/oberlunar_btcusd
My community is free, but if you’re not present and
don’t interact, you’re out.
Penafian
Maklumat dan penerbitan adalah tidak bertujuan, dan tidak membentuk, nasihat atau cadangan kewangan, pelaburan, dagangan atau jenis lain yang diberikan atau disahkan oleh TradingView. Baca lebih dalam Terma Penggunaan.