PROTECTED SOURCE SCRIPT
MRL Slim — SuperBuy/Sell + Bands (v6.4)

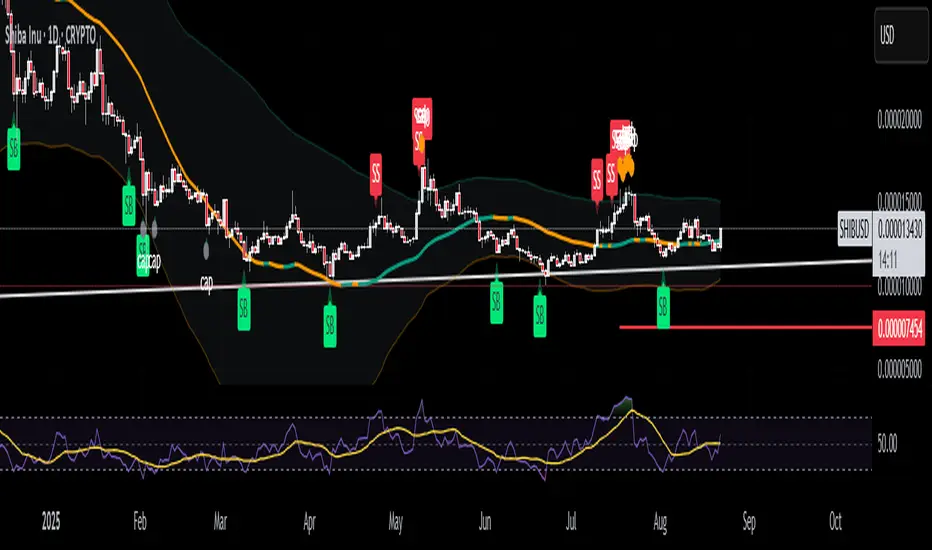
MRL — Mean Reversion Bands + Super Buy/Sell (RSI-10)
What it does
This overlay plots a mean-reversion line (linear regression of price) with k·σ bands and adds clean RSI-10 signals on the chart.
Signals (tags on price):
SB = Super Buy: fires when RSI(10) (on close) crosses down through your oversold threshold (default 29).
– Capped to 2 touches per cycle; the cycle resets when RSI crosses above 50 (configurable).
SS = Super Sell (71): fires when RSI(10) crosses up through your overbought threshold (default 71).
SS80 = Super Sell (Hard):
– Fires on cross above 80, and (optionally) again while RSI ≥ 80 using a cooldown to prevent spam.
– Per-cycle cap = 2 by default; you can let hard sells bypass the cap.
Bands & Source
Bands are built around a linreg mean of your chosen Source (default hlc3).
Toggle Log Space to make bands act percent-like on long histories/trending assets.
Filters (optional)
Price ≥ Upper Band required for sells.
Mean slope down required for sells.
(Disable if you want every RSI event, even in strong trends.)
Debug (optional)
Turn on Debug to see raw RSI crosses/touches and why a signal was blocked (e.g., cap, band, slope, cooldown).
Separate toggle to show/hide CAP dots.
Tips
For fast charts or very strong momentum, consider loosening the sell filters or shortening the HARD cooldown.
If your panel RSI shows signals you don’t see on price: ensure you’re comparing RSI(10, close) on the same timeframe.
Disclaimer
For research/education only. Not financial advice; always manage risk.
Skrip dilindungi
Skrip ini diterbitkan sebagai sumber tertutup. Akan tetapi, anda boleh menggunakannya dengan percuma dan tanpa had – ketahui lebih lanjut di sini.
Penafian
Maklumat dan penerbitan adalah tidak dimaksudkan untuk menjadi, dan tidak membentuk, nasihat untuk kewangan, pelaburan, perdagangan dan jenis-jenis lain atau cadangan yang dibekalkan atau disahkan oleh TradingView. Baca dengan lebih lanjut di Terma Penggunaan.