OPEN-SOURCE SCRIPT
Telah dikemas kini + TRSI
Hello again.
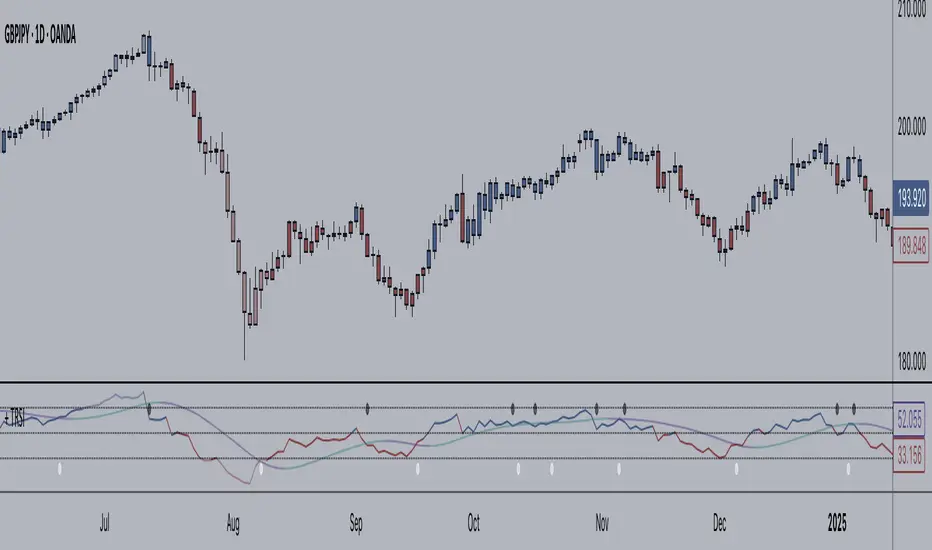
Here I have an improved version of the RSI that is similar to my "+ %B" indicator (that, an improved version of the %B).
This version of the RSI includes candle coloring for bullish or bearish bias (is the RSI above or below its median line?), as well as candle coloring for overbought and oversold areas. Additionally, there is an option for coloring candles based on the RSI crossing up or down its moving average.
So, that takes us on to the moving average. You have a selection of these, namely: SMA, EMA, DEMA, TEMA, HMA, JMA, LSMA, MF, SMA (the default), TMA, VAMA, and WMA. These are all very different, so play around and choose one that fits your trading style, or whatever it is you're looking for (or even turn it off if you like!).
I've added alerts, so you can be alerted based on wherever the RSI goes. Is it oversold? Did it just cross the median? Did it cross up or down its MA?
I hope you enjoy it!
Nota Keluaran
Hello. It's me, Scott, with an update to this.Additions simply include:
1) two more levels--median high and median low-- between overbought/oversold levels and the median level, if you find that useful.
2) alerts for overbought and oversold conditions, median crosses, and MA crosses.
3) multi-timeframe because why not.
Also, please note that I have an identical indicator called +TrueRSI that I really do mean is identical. Tradingview confuses me. I thought that for some reason my script wasn't accepted because it didn't past muster or something, but in reality a weird thing happens where if you favorite the script you are working on, then publish it, the script you saved IS NOT the published one, and you actually have to search for it. So I was like, "oh, they didn't accept it for some reason?" because it wasn't showing my name (therefore not able to be found by anyone) in my favorites section. So, before bothering to search (because why would I think that!?) I made another one and published that. So now there are two of the same indicator under slightly different names. And that's my story. It's stupid, but what can ya do? I also can't delete it, and they probably won't, because they say that goes against there policy, so I probably will have two of the same indicator up here for all eternity. :)
Nota Keluaran
In this updated version I've cleaned up the candle coloring code, as well as made some changes to the default colors. I've also made the MA color changing based on its bull/bear bias, and I've done this with the RSI too.Also, a minor update to the candles: I added a "neutral" color to them based on the RSI's relation to the median and the moving average. Basically if the RSI is below the moving average but above the median line, or above the moving average and below the median line, it is considered neutral. I like it as a way of highlighting indecision, consolidation, or potential reversal points.
Oh, and lastly, you can turn off candle coloring on the inputs screen, so you don't have to individually unclick each box under "style."
Hope you like these updates.
Nota Keluaran
some very important updates here! (also, note that this is no different than my other + True RSI indicator--I accidentally published two, back in the days when I didn't know what I was doing).This is mainly as a result of a question I received from a user about the use of the secondary DPO in my + DPO indicator (check it out, btw, it's a highly underrated oscillator, imo). And, while understanding the use myself, I realized that my implementation of DPO+DPO crosses was WRONG for the intended use of the second DPO. This realization has carried over into this script (and my Accumulation/Distribution Percentage script, and my implementation of indications around how the second RSI should be used in conjunction with the first, and with all other parts of the indicator. If you want to read why I changed what I did I would suggest checking the update on my +DPO indicator because I don't feel like typing it out again; the reasoning is the same.
With the change in how I've approached the momentum issue between the two different RSI's and the median, I've actually changed certain default settings of this indicator, while also adding background coloring as an indication for what I would call momentum shifts (or possible momentum shifts). The secondary RSI is on by default and set to a length of 55. You can use this as a filter if you like, in the same way one might use a baseline moving average on a price chart for taking directional trades (that being trading with the dominant momentum).
Added bollinger bands, because I utilize it in most of my other indicators, so why not? If you don't want it just turn it off. :)
Eliminated the background shading.
Cleaned up a bunch of the code. Made the inputs side of things prettier.
That's all! Thanks! And happy trading!
Nota Keluaran
updated moving average color -- minor changeNota Keluaran
wow, did not realize I had changed the candle color to reflect differently than the RSI plot. Apologies. Obviously was toying with some different coding ideas and forgot that I had changed that?Nota Keluaran
I stopped updating this script ages ago because when I was new to all of this I didn't know what the hell I was doing when publishing scripts, so I accidentally made a second copy of the same indicator under a different name (I think I wanted to change the name of the script after publishing, but you can't do that). People keep boosting this one though (and I assume using it?), so I may as well update it. It's identical to my + True RSI script, though, fyi.If you want to know what all the updates have been you should take a look at that. I'm not retyping everything here.
Nota Keluaran
Apologies for the ping/email if you get them. I made a mistake with 'color2' in the code and realized it while updating +accumulationdistribution today. That has been fixed now. That's all.Nota Keluaran
- fixed an issue with signal line color, or smoothed RSI color when used as a signal line- added a signal line color fill
Nota Keluaran
This is the final update (at least for the next many many months) for all the indicators I have updated in 2025. It seemed like every time I updated and published one, because they have so many similarities between them, and the large amount of copying and pasting I did, I would identify things that I messed up or decided I wanted changed while updating the next one. I have now gone through all of them with a fine-tooth comb, as the saying goes, so that code should be consistent across all of them. That's basically it. Functionally, nothing has changed since I began updating these this year. These changes are so minor you probably won't even notice them.Skrip sumber terbuka
Dalam semangat TradingView sebenar, pencipta skrip ini telah menjadikannya sumber terbuka, jadi pedagang boleh menilai dan mengesahkan kefungsiannya. Terima kasih kepada penulis! Walaupuan anda boleh menggunakan secara percuma, ingat bahawa penerbitan semula kod ini tertakluk kepada Peraturan Dalaman.
Penafian
Maklumat dan penerbitan adalah tidak bertujuan, dan tidak membentuk, nasihat atau cadangan kewangan, pelaburan, dagangan atau jenis lain yang diberikan atau disahkan oleh TradingView. Baca lebih dalam Terma Penggunaan.
Skrip sumber terbuka
Dalam semangat TradingView sebenar, pencipta skrip ini telah menjadikannya sumber terbuka, jadi pedagang boleh menilai dan mengesahkan kefungsiannya. Terima kasih kepada penulis! Walaupuan anda boleh menggunakan secara percuma, ingat bahawa penerbitan semula kod ini tertakluk kepada Peraturan Dalaman.
Penafian
Maklumat dan penerbitan adalah tidak bertujuan, dan tidak membentuk, nasihat atau cadangan kewangan, pelaburan, dagangan atau jenis lain yang diberikan atau disahkan oleh TradingView. Baca lebih dalam Terma Penggunaan.