Kruegger

Bollinger Bands %B(RSI, Stoch) [Kru]

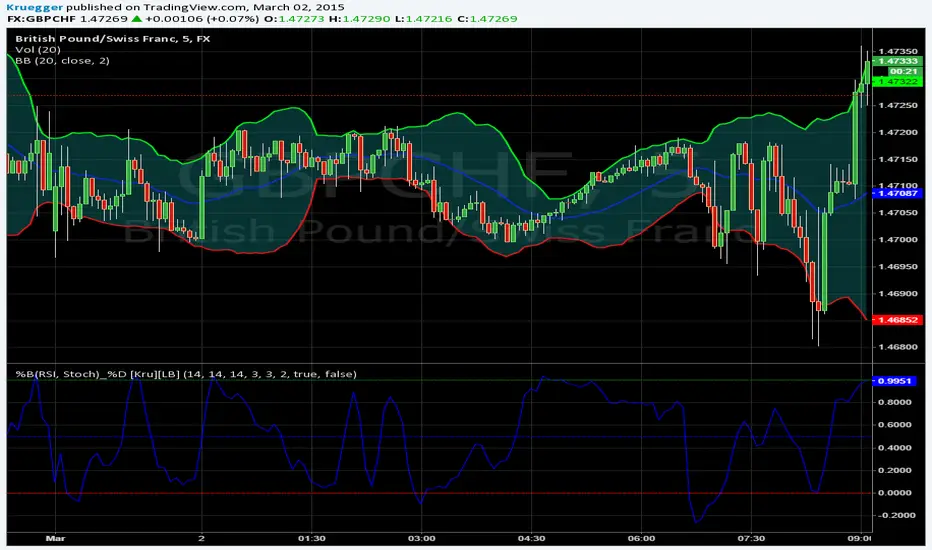
Calculate %B for RSI, Stoch, using Bollinger Bands algorithm.
Skrip sumber terbuka

Dalam semangat TradingView yang sebenar, penulis skrip ini telah menerbitkannya dengan menggunakan sumber terbuka supaya pedagang-pedagang dapat memahami dan mengesahkannya. Sorakan kepada penulis! Anda dapat menggunakannya secara percuma tetapi penggunaan semula kod ini dalam penerbitan adalah dikawalselia oleh Peraturan Dalaman. Anda boleh menyukainya untuk menggunakannya pada carta.

Penafian

Maklumat dan penerbitan adalah tidak dimaksudkan untuk menjadi, dan tidak membentuk, nasihat untuk kewangan, pelaburan, perdagangan dan jenis-jenis lain atau cadangan yang dibekalkan atau disahkan oleh TradingView. Baca dengan lebih lanjut di Terma Penggunaan.

Ingin menggunakan skrip ini pada carta?
//
// @author Kruegger
//
// based on RSI/MFI with Bollinger Bands. Dynamic Oversold/Overbought levels, yayy! by @author LazyBear
// 
study(title = "RSI/Stoch %B Bolly bands by [Kruegger] based on [LazyBear]", shorttitle="%B(RSI, Stoch)_%D [Kru][LB]")
source = close
length_rsi = input(14, minval=1, title="RSI Length")
length_stoch = input(14, minval=1, title="Stoch Length")
lengthMA = input(14, minval=1, title="MA Length")
lengthD = input(3, minval=1, title="%D Length")
signal = input(3, minval=1, title="Signal smooth")

mult = input(2.0, minval=0.001, maxval=3, title="StDev Mult")
DrawRSI=input(true, title="Draw %B(RSI) ?", type=bool)
DrawStoch=input(false, title="Draw %B(Stoch) ?", type=bool)

// rsi
rsi_k = rsi(source, length_rsi)
rsi = sma(rsi_k,lengthD)
basis_rsi = sma(rsi, lengthMA)
dev_rsi = mult * stdev(rsi, length_rsi)
upper_rsi = basis_rsi + dev_rsi
lower_rsi = basis_rsi - dev_rsi
rsi_b = (rsi-lower_rsi) / (upper_rsi-lower_rsi)

// stoch
stoch_k = stoch(source, high, low, length_stoch)
stoch = sma(stoch_k,lengthD)
basis_stoch = sma(stoch, lengthMA)
dev_stoch = mult * stdev(stoch, length_stoch)
upper_stoch = basis_stoch + dev_stoch
lower_stoch = basis_stoch - dev_stoch
stoch_b = (stoch-lower_stoch) / (upper_stoch-lower_stoch)

// plot %b (RSI, Stoch)
plot(DrawRSI ? rsi_b:na, color=blue, linewidth=1, title="%B(RSI)")
plot(DrawStoch ? stoch_b:na, color=yellow, linewidth=1, title="%B(Stoch)")
//plot(DrawRSI ? rsi_b:na, color= (rsi_b > 0 and rsi_b[1] < 0)?blue:red, linewidth=1, title="%B(RSI)")

// Draw support line
h1 = hline(0.0, color=red, title="Lower Limit")
h2 = hline(1.0, color=green, title="Upper Limit")
h3 = hline(0.5, color=blue, title="Middle Limit")

//plotshape(rsi_b > 0 and rsi_b[1] < 0, color=lime, style=shape.triangleup, text="Buy", location=location.bottom)
//plotshape(falling(rsi_b[signal],signal), color=lime, style=shape.triangleup, text="Buy", location=location.bottom)
//plotshape(rsi_b < rsi_b[signal] and rsi_b[signal] >= rsi_b[signal-1], color=red, style=shape.triangledown, text="Sell", location=location.top)