OPEN-SOURCE SCRIPT
Volume Crossover Strategy
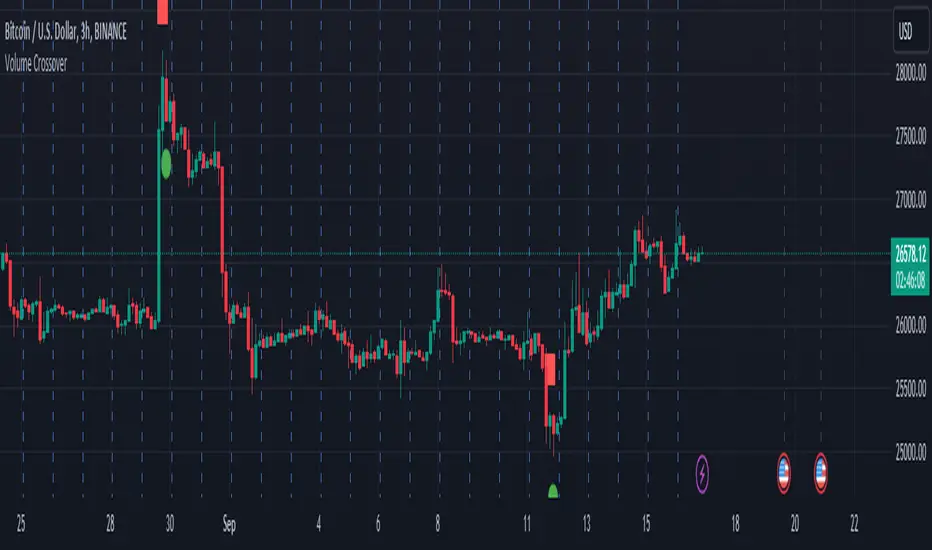
This script shows us the strength and acceleration of the trend, not the direction. ! . The indicator is built on the collision of two volumes (the collision of one-hour and four-hour volumes), where as a result one upward arrow shows us (acceleration, pressing the gas on the pedal), and the downward one shows deceleration (i.e. braking).
Recommendation: Be sure to attach:
a) any trend direction indicator (SMA, EMA), through which we will have an idea where the market is going and going:
b) volatility indicator
c) AD accumulation distribution (let's have a real picture, is there a buying or selling trend)
It is suitable for a one-hour timeframe
P.S. The script does not make any guarantee of profit, it is published only for the purpose of sharing my opinion about this strategy.
an hour ago
Comment:
The green signal is the start of the marathon, and the red signal is the end. For example, if the downward trend has ended (we can see it through the blue signal), it does not mean that the next marathon will necessarily be a reflected trend. It is not excluded that the next marathon will also develop on a downward trend...and therefore in the opposite case as well..
Skrip sumber terbuka
Dalam semangat TradingView sebenar, pencipta skrip ini telah menjadikannya sumber terbuka, jadi pedagang boleh menilai dan mengesahkan kefungsiannya. Terima kasih kepada penulis! Walaupuan anda boleh menggunakan secara percuma, ingat bahawa penerbitan semula kod ini tertakluk kepada Peraturan Dalaman.
Penafian
Maklumat dan penerbitan adalah tidak bertujuan, dan tidak membentuk, nasihat atau cadangan kewangan, pelaburan, dagangan atau jenis lain yang diberikan atau disahkan oleh TradingView. Baca lebih dalam Terma Penggunaan.