OPEN-SOURCE SCRIPT
Telah dikemas kini Differential-Isaac-Newton
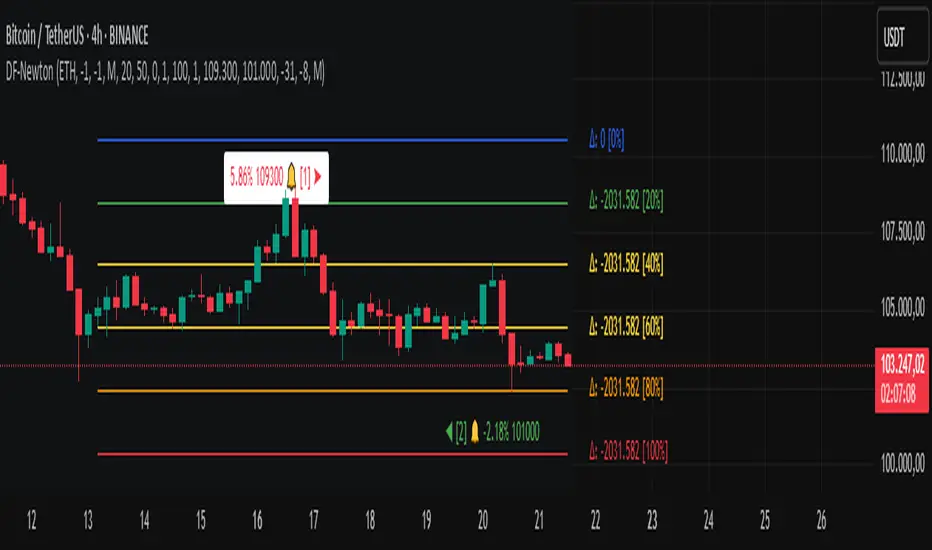
Description of the Differential-Isaac-Newton Indicator (DF-Newton)
This indicator plots custom Fibonacci levels on the chart using configurable multiples and offers various display options to assist with technical analysis.
What does it do?
Calculates and plots Fibonacci levels based on user-defined multiples (default multiple is 20).
Allows switching between long mode (buy) and short mode (sell) to adjust the levels accordingly.
Displays horizontal lines at Fibonacci levels with customizable colors and styles.
Shows labels with different information such as level price, Fibonacci percentage, and difference between levels.
Includes controls to show/hide different elements and customize the appearance.
How to use it?
Main Settings
Multiple of 2 for Fibonacci: Defines the percentage interval used to calculate Fibonacci levels (e.g., 20 creates levels at 0%, 20%, 40%, etc.).
Line Horizontal Offset: Defines the horizontal distance (in bars) of the Fibonacci line to improve visibility.
Short Mode: Enable to calculate levels based on a downward movement (from low to high).
Classic Mode: Changes the line colors to a classic Fibonacci color scheme (blue, green, yellow, orange, red).
Toggle Solid Line: Switches between solid and dotted lines for Fibonacci levels.
Labels
Choose which information to display on the labels next to the lines:
Show Only Level Prices: Displays only the Fibonacci level price.
Show Only Level Percentages: Displays only the Fibonacci percentage level.
Show Difference Values (Δ): Shows the difference between the current and previous level, along with the percentage (which can be hidden).
Hide Percentage in Difference Mode: Hides the percentage when difference mode is enabled.
Hide All Labels: Hides all labels from the chart.
Visual Customization
Label Size: Size of the label text (XS, S, M, L).
Label Horizontal Offset: Horizontal distance of labels relative to the lines.
Background Offset: Adjusts background color offset for better visibility.
Fibonacci Line Color: Color of the Fibonacci lines (when classic mode is off).
Label Text Color: Color of the label text.
Level Interpretation
Fibonacci levels are calculated between the highest high and lowest low of the last 100 candles.
The indicator plots horizontal lines at Fibonacci levels according to the selected multiple.
Line colors help identify important levels (configurable in classic mode).
Labels show the exact level price and Fibonacci percentage, helping with entry, exit, support, and resistance decisions.
Recommendations
Use Short Mode to analyze Fibonacci levels for sell trades.
Use Classic Mode for a traditional color scheme and easier identification.
Adjust Line Horizontal Offset to avoid overlapping current candles.
Combine price and percentage display for easier analysis.
Explore Difference Mode (Δ) to understand gaps between consecutive Fibonacci levels.
Practical Example
If you set the multiple to 20, the indicator will show levels at 0%, 20%, 40%, 60%, 80%, and 100%. Each level will have a horizontal line and a label showing the corresponding price and percentage, or the difference from the previous level, depending on your settings.
Nota Keluaran
Update: New improvements added! Now users can hide the colored background of labels and display text only. You can also create a split background effect: just enter a negative value in the background offset field, like -100 as an example. This will make Background Color 2 appear behind Background Color 1, giving you a "half and half" color effect on the chart background. In addition, you now have full control to select your own Background Color 1 and Background Color 2 to match your style preferences. Important: If you want to freely adjust the line colors and label text colors, make sure to disable both "Classic Mode" and "Enable Magic Mode", if they are turned on.Nota Keluaran
Update: Improvements made to the Fibonacci indicatorAdded the ability to compact values with extra zeros (for Meme Coins) to improve readability.
Fibonacci levels now work both automatically and with fixed values.
Users can select fixed manual values by enabling a button or manually typing the cryptocurrency name and save the data, even when offline.
However, since TradingView scripts do not have cloud storage, the fixed values for each coin must be saved manually on TradingView’s server by clicking save and load — this way your manually entered fixed values will be preserved.
To avoid visual clutter, you can disable the inputs for fixed values so they do not appear on the chart.
When compacting Meme Coin values, there should be no issues, but if any conflict arises, you can disable the compacting feature.
Also, in price difference mode, disable the compacting of extra zeros for Meme Coin values to prevent conflicts.
The cryptocurrency name can be typed manually and changed to any crypto you want.
Nota Keluaran
Update:I’ve adjusted the indicator buttons to make life easier for the trader, keeping them close together instead of spread out. Also, remember: activating Price Mode cannot be combined with Differential Mode to avoid conflicts. When you turn on one of the Price Modes, make sure Differential Mode is off. Similarly, when using the Meme Coin value compaction feature, disable Differential Mode as well to prevent conflicts and ensure everything works correctly.
Nota Keluaran
Thank-you Nota Keluaran
Update: A new feature was added allowing users to adjust the number of candle lines displayed on the chart. Many advanced features have been implemented, going beyond the average standard. Additionally, the value compacting for memecoins has been improved: the letter D now represents decimal-based values, K represents thousands, and M represents millions.Nota Keluaran
UpdateWe’ve added a new button for adjusting the line width setting. Now the value can be fixed between 1 and 2 for line width adjustment.
Another important point: be careful when setting a fixed price. If the entered value is far above or below the actual price of the cryptocurrency, the chart may disappear.
Remember: this indicator works both in fixed mode and in automatic mode, depending on the user’s choice.
Nota Keluaran
Update: Improvements have been made to the number of line grid levels. Now, users can set from 20 up to 1000 grid lines on the line charts. Additionally, it is possible to lock customizable fixed values on the Monthly, 6 Months, and any other timeframe, making the default grid value of 100 fully flexible.Nota Keluaran
Update for all users: New Sound Alerts for TradersDear users,
I’ve just released a new update to the indicator. It now includes 2 customizable sound alerts, which you can set at any price level you choose.
This improvement was made in response to requests from traders who needed this functionality. As the original author, only I can publish official updates without being blocked by the TradingView moderators. Even if other users attempt to modify or improve the script, republication is not allowed — the platform’s moderators automatically block it to protect the originality of the work.
Thank you all for your continued support and for being part of the community.
Enjoy the new features and successful trading to everyone!
Nota Keluaran
update ="This text has been improved for better grammar and clearer comprehension."Nota Keluaran
New update: offset adjustment of the sound labels, hiding Fibonacci values while keeping the sound labels visible.Nota Keluaran
update Now the user has the option to display the alert price on the label."Nota Keluaran
Update: signal arrows have been added for the market in short-term, long-term, monthly, weekly, 6-month, and annual timeframes. The default arrow period is 3 but can be adjusted. Setting it to 2 makes it very sensitive. Setting it to 1 is not allowed because the arrows disappear. The higher the number, the less sensitive it is but it delays the trend, okay?Nota Keluaran
There was a slight delay in updating the arrow formula because I had to go back and fix the error — it was small but would become big if left unfixed.Nota Keluaran
"Update: Visual improvements have been added to the grammar and percentage labels of sound alerts. The percentage (%) now reflects positive values when above the initial cryptocurrency value, and negative percentages indicate a decline from the initial cryptocurrency value."Nota Keluaran
Update: We've added a dynamic background color for the signal arrows, allowing users who prefer not to display the arrows to still benefit from a cleaner visual experience.Nota Keluaran
update "Improvements have been made to the alert label arrows and the independent offset positioning of the alert labels."Nota Keluaran
update: Bug fix applied to the indicator.Nota Keluaran
update: Arrows were removed due to false signals from small price fluctuations. Use RSI, SMI, volume, and other indicators to confirm trends. This indicator does not show trend direction. Invest with caution. We improved the alert arrow — it can now invert its position from left to right.Nota Keluaran
Update ColorNota Keluaran
"Improvements were made to the offsets of the sound alert labels; they are now unlimited and free. The label inversion was fixed, as there was an issue with zoom when inverting the values of the sound alert labels. The zoom spacing now stays fixed even when inverted. Ok."Nota Keluaran
"Update: Nobody surpasses the master because he is unique — updated elegant label without pointers."Nota Keluaran
Update:Adjust label positioning with an option to enable labels independently — showing only text without the label background. Also, add the ability to hide alert labels visually while keeping the sound alert active.
Skrip sumber terbuka
Dalam semangat TradingView sebenar, pencipta skrip ini telah menjadikannya sumber terbuka, jadi pedagang boleh menilai dan mengesahkan kefungsiannya. Terima kasih kepada penulis! Walaupuan anda boleh menggunakan secara percuma, ingat bahawa penerbitan semula kod ini tertakluk kepada Peraturan Dalaman.
Penafian
Maklumat dan penerbitan adalah tidak bertujuan, dan tidak membentuk, nasihat atau cadangan kewangan, pelaburan, dagangan atau jenis lain yang diberikan atau disahkan oleh TradingView. Baca lebih dalam Terma Penggunaan.