OPEN-SOURCE SCRIPT
Price Channel Marker
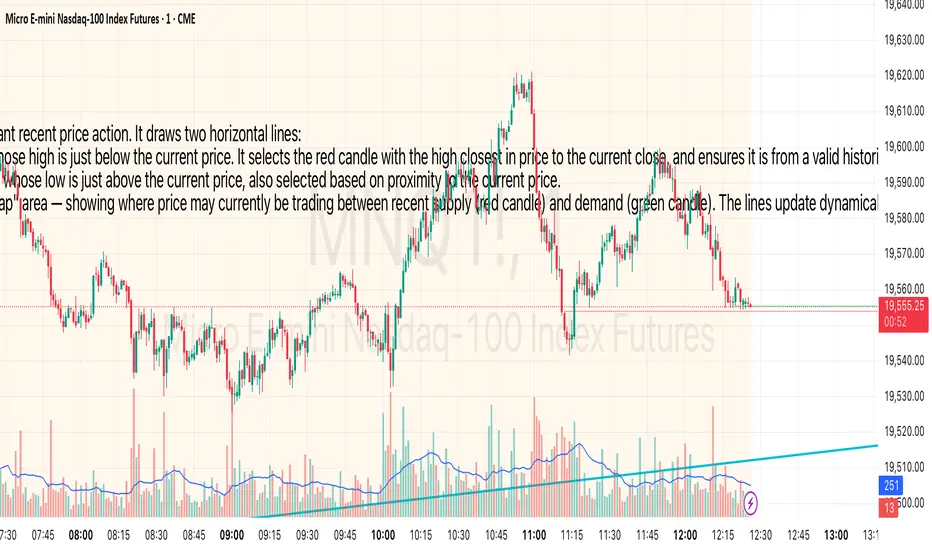
This indicator identifies a dynamic price channel based on the most relevant recent price action. It draws two horizontal lines:
* 🔴 Red Line – Marks the high of the most recent red candle (bearish) whose high is just below the current price. It selects the red candle with the high closest in price to the current close, and ensures it is from a valid historical context (ignoring recent highs above the current price).
* 🟢 Green Line – Marks the low of the most recent green candle (bullish) whose low is just above the current price, also selected based on proximity to the current price.
Together, these two lines define a potential price compression zone or "trap" area — showing where price may currently be trading between recent supply (red candle) and demand (green candle). The lines update dynamically and extend into the future to help visualize breakout or rejection levels.
Use Cases:
* Spot potential breakout zones.
* Define short-term support and resistance.
* Filter for entries in range-bound or squeeze conditions.
Customization:
* Adjustable lookback range (up to 5000 bars).
* Colors and line style are easily customizable.
Skrip sumber terbuka
Dalam semangat TradingView sebenar, pencipta skrip ini telah menjadikannya sumber terbuka, jadi pedagang boleh menilai dan mengesahkan kefungsiannya. Terima kasih kepada penulis! Walaupuan anda boleh menggunakan secara percuma, ingat bahawa penerbitan semula kod ini tertakluk kepada Peraturan Dalaman.
Penafian
Maklumat dan penerbitan adalah tidak bertujuan, dan tidak membentuk, nasihat atau cadangan kewangan, pelaburan, dagangan atau jenis lain yang diberikan atau disahkan oleh TradingView. Baca lebih dalam Terma Penggunaan.