PROTECTED SOURCE SCRIPT
Time Based Statistics
This indicator is a complex time-based statistics tool for analyzing intraday trading patterns. Here's a comprehensive breakdown:
1. **Session Management**
- Tracks trading sessions from 18:00 to 16:59 next day (using New York time)
- Separates analysis by weekdays (Monday through Friday)
- Resets statistics at week's end
2. **High/Low Time Tracking**
- Records when daily highs and lows occur for each day
- Maintains historical arrays of high/low times for pattern analysis
- Tracks high/low patterns in three main time periods:
- Evening/Overnight (18:00-23:59)
- Early Morning (00:00-09:59)
- Market Hours (10:00-16:59)
3. **Probability Calculations**
The indicator calculates several probabilities:
a) **Hold Probability**
- Calculates likelihood current high/low will remain day's high/low
- Counts how many historical highs/lows occurred in remaining hours
- Returns percentage based on historical patterns
b) **Most Frequent Times**
- Identifies which times most frequently produce highs/lows
- Tracks both primary and secondary (next highest) probable times
- Maintains historical counts of highs/lows by hour
4. **Pattern Analysis**
- Filters historical times based on current time
- Helps predict potential future high/low times
- Adjusts analysis based on time of day
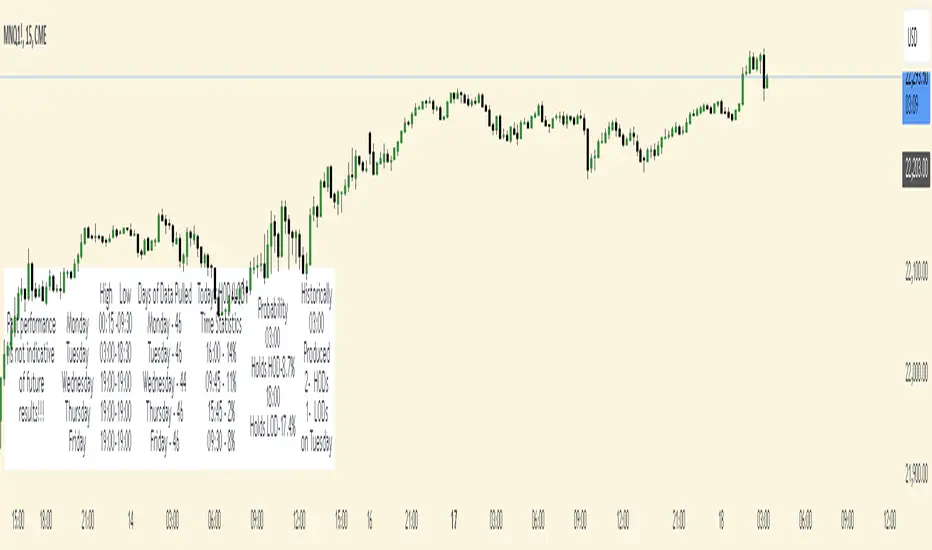
5. **Data Display**
Shows statistics in a table including:
- Days of data analyzed
- Current day's high/low times
- Most frequent times for today's highs/lows
- Probability of current high/low holding
- Historical patterns for current hour
6. **Historical Data Management**
- Stores daily high/low data at week's end
- Maintains separate arrays for each day of the week
- Uses this historical data for pattern analysis
The indicator helps traders by:
- Understanding when highs/lows typically occur
- Assessing probability of new highs/lows
- Identifying historically significant time periods
- Providing statistical basis for timing decisions
1. **Session Management**
- Tracks trading sessions from 18:00 to 16:59 next day (using New York time)
- Separates analysis by weekdays (Monday through Friday)
- Resets statistics at week's end
2. **High/Low Time Tracking**
- Records when daily highs and lows occur for each day
- Maintains historical arrays of high/low times for pattern analysis
- Tracks high/low patterns in three main time periods:
- Evening/Overnight (18:00-23:59)
- Early Morning (00:00-09:59)
- Market Hours (10:00-16:59)
3. **Probability Calculations**
The indicator calculates several probabilities:
a) **Hold Probability**
- Calculates likelihood current high/low will remain day's high/low
- Counts how many historical highs/lows occurred in remaining hours
- Returns percentage based on historical patterns
b) **Most Frequent Times**
- Identifies which times most frequently produce highs/lows
- Tracks both primary and secondary (next highest) probable times
- Maintains historical counts of highs/lows by hour
4. **Pattern Analysis**
- Filters historical times based on current time
- Helps predict potential future high/low times
- Adjusts analysis based on time of day
5. **Data Display**
Shows statistics in a table including:
- Days of data analyzed
- Current day's high/low times
- Most frequent times for today's highs/lows
- Probability of current high/low holding
- Historical patterns for current hour
6. **Historical Data Management**
- Stores daily high/low data at week's end
- Maintains separate arrays for each day of the week
- Uses this historical data for pattern analysis
The indicator helps traders by:
- Understanding when highs/lows typically occur
- Assessing probability of new highs/lows
- Identifying historically significant time periods
- Providing statistical basis for timing decisions
Skrip dilindungi
Skrip ini diterbitkan sebagai sumber tertutup. Akan tetapi, anda boleh menggunakannya secara bebas dan tanpa apa-apa had – ketahui lebih di sini.
Penafian
Maklumat dan penerbitan adalah tidak bertujuan, dan tidak membentuk, nasihat atau cadangan kewangan, pelaburan, dagangan atau jenis lain yang diberikan atau disahkan oleh TradingView. Baca lebih dalam Terma Penggunaan.