PROTECTED SOURCE SCRIPT
filbfilbs Better OBV
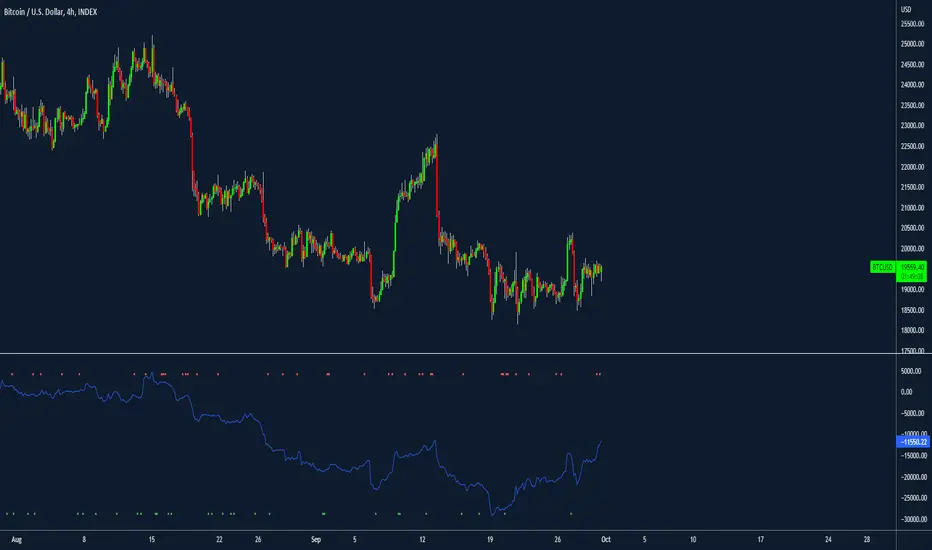
This indicator looks at the delta on the buying and selling volume of customizable lower timeframes to the timeframe selected and cumulates the delta between the buying and selling of those candles.
For example on a 4-hour chart, it will look at the 1 min timeframes and consider the delta by LTF candle, ranter than the summised view on the 4-hour.
In essence, it is trying to replicate CVD using time and price data without the order book, it becomes a "better, lower timeframe based, customizable OBV"
It also prints divergence as squares above or below the chart, where, for example, there would be buying on LTFs but the HTF candle closes red, this would be shown as bearish divergence.
Credit to Trading view and their up / down indicator, which this is a derivative of.
Any questions please ask!
Skrip dilindungi
Skrip ini diterbitkan sebagai sumber tertutup. Akan tetapi, anda boleh menggunakannya secara bebas dan tanpa apa-apa had – ketahui lebih di sini.
Penafian
Maklumat dan penerbitan adalah tidak bertujuan, dan tidak membentuk, nasihat atau cadangan kewangan, pelaburan, dagangan atau jenis lain yang diberikan atau disahkan oleh TradingView. Baca lebih dalam Terma Penggunaan.