OPEN-SOURCE SCRIPT
Telah dikemas kini Break/Reversal/Touch [Intromoto]
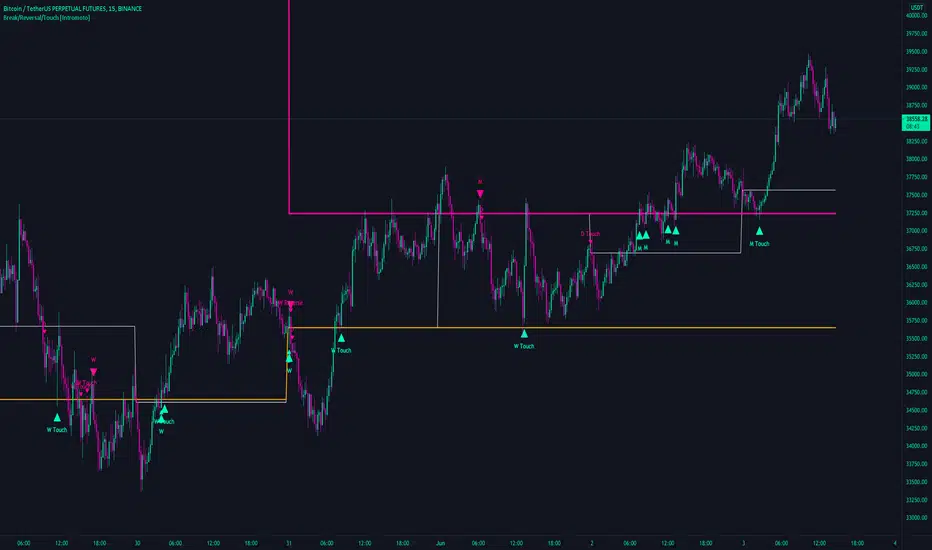
This script shows the engulfing breaks, touches and potential reversals for when prices arrives at certain time frame closes.
On publishing it shows the crossovers of the 6 hour, Daily, Weekly, and Monthly time frames.
The candle main signals are contingent on crossing over the closing level, and engulfing the previous candle. Secondary signals occur when the candle low or high touch the closing levels, in the directional color, i.e. you'll get a bearish touch signal if the candle high touches the level, and it's a red candle. Reversals occur when the subsequent candle breaks a closing level, but the current candle engulfs the previous candle in the opposing direction.
If a candles low or high hits a daily, weekly, or monthly close level it also will plot a "D/W/M Touch" in the according direction.
Thanks
Nota Keluaran
Styling and fixed repainting for plots. Visible by defaultNota Keluaran
Removed 6 hour res. Style changes. Added alerts. Skrip sumber terbuka
Dalam semangat TradingView sebenar, pencipta skrip ini telah menjadikannya sumber terbuka, jadi pedagang boleh menilai dan mengesahkan kefungsiannya. Terima kasih kepada penulis! Walaupuan anda boleh menggunakan secara percuma, ingat bahawa penerbitan semula kod ini tertakluk kepada Peraturan Dalaman.
DM for access.
Follow on Twitter for updates.
One time fee, no subscription
twitter.com/IntroMoto
Follow on Twitter for updates.
One time fee, no subscription
twitter.com/IntroMoto
Penafian
Maklumat dan penerbitan adalah tidak bertujuan, dan tidak membentuk, nasihat atau cadangan kewangan, pelaburan, dagangan atau jenis lain yang diberikan atau disahkan oleh TradingView. Baca lebih dalam Terma Penggunaan.
Skrip sumber terbuka
Dalam semangat TradingView sebenar, pencipta skrip ini telah menjadikannya sumber terbuka, jadi pedagang boleh menilai dan mengesahkan kefungsiannya. Terima kasih kepada penulis! Walaupuan anda boleh menggunakan secara percuma, ingat bahawa penerbitan semula kod ini tertakluk kepada Peraturan Dalaman.
DM for access.
Follow on Twitter for updates.
One time fee, no subscription
twitter.com/IntroMoto
Follow on Twitter for updates.
One time fee, no subscription
twitter.com/IntroMoto
Penafian
Maklumat dan penerbitan adalah tidak bertujuan, dan tidak membentuk, nasihat atau cadangan kewangan, pelaburan, dagangan atau jenis lain yang diberikan atau disahkan oleh TradingView. Baca lebih dalam Terma Penggunaan.