OPEN-SOURCE SCRIPT
Ultimate Gold Correlation Matrix (Extended)
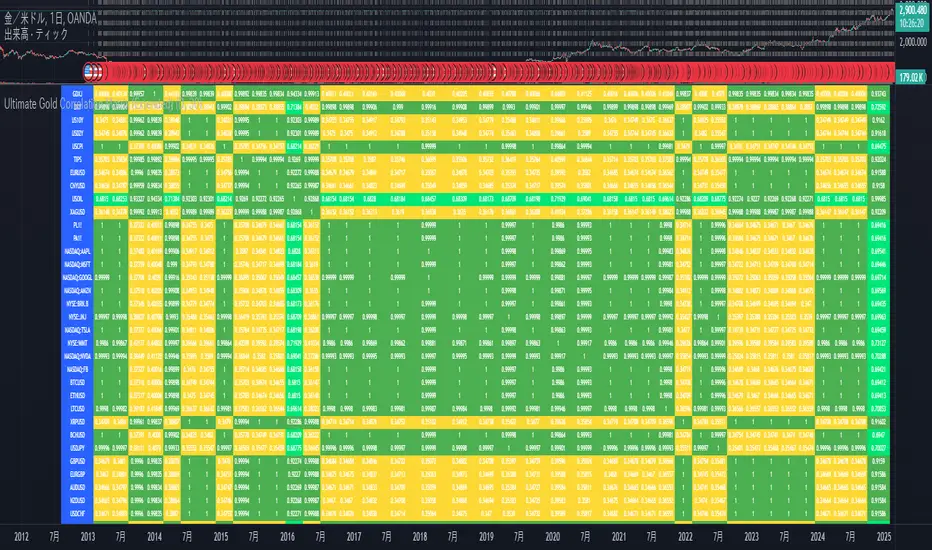
This is a correlation matrix to help you visually understand the relationship between stocks. This is the correlation of the amount of change.
The color changes depending on the value of the correlation value.
By making a node diagram of this relationship, what has been difficult to understand may become clearer.
Good luck.
1. meaning of correlation coefficient
Correlation Coefficient ranges from -1 to +1.
Correlation Coefficient Value Interpretation
+1.00 Perfect positive correlation (when one goes up, the other always goes up)
+0.75 ~ +0.99 Strong positive correlation (fairly well linked)
+0.50 ~ +0.74 Moderate positive correlation
+0.30 ~ +0.49 Weak positive correlation
-0.30 ~ +0.30 No correlation (no or weak relationship)
-0.50 ~ -0.74 Moderate negative correlation
-0.75 ~ -0.99 Strong negative correlation (when one goes up, the other goes down)
-1.00 Perfect negative correlation (opposite moves)
Translated with DeepL.com/Translator (free version)
Skrip sumber terbuka
Dalam semangat TradingView sebenar, pencipta skrip ini telah menjadikannya sumber terbuka, jadi pedagang boleh menilai dan mengesahkan kefungsiannya. Terima kasih kepada penulis! Walaupuan anda boleh menggunakan secara percuma, ingat bahawa penerbitan semula kod ini tertakluk kepada Peraturan Dalaman.
Penafian
Maklumat dan penerbitan adalah tidak bertujuan, dan tidak membentuk, nasihat atau cadangan kewangan, pelaburan, dagangan atau jenis lain yang diberikan atau disahkan oleh TradingView. Baca lebih dalam Terma Penggunaan.