OPEN-SOURCE SCRIPT
Advanced Multi-Timeframe Trend Detector
This script is designed to provide a multi-timeframe trend analysis, combining moving averages (MAs) and the Relative Strength Index (RSI) to determine market direction across different timeframes. Here's a breakdown of what the script does:
Key Components of the Script
Inputs:
Moving Averages: Short and long moving average lengths (9 and 21 periods).
ATR and RSI Lengths: ATR (Average True Range) and RSI (Relative Strength Index) lengths set to 14 periods.
RSI Levels: Overbought and oversold levels for the RSI set to 70 and 30, respectively.
Trend Determination:
A function called trendDirection evaluates the trend based on the closing prices of the current and previous periods, as well as the RSI value.
It classifies the trend as "Up", "Down", or "Sideways" based on the conditions:
Up: Current close is higher than the previous close and RSI is below the overbought level.
Down: Current close is lower than the previous close and RSI is above the oversold level.
Sideways: If neither condition is met.
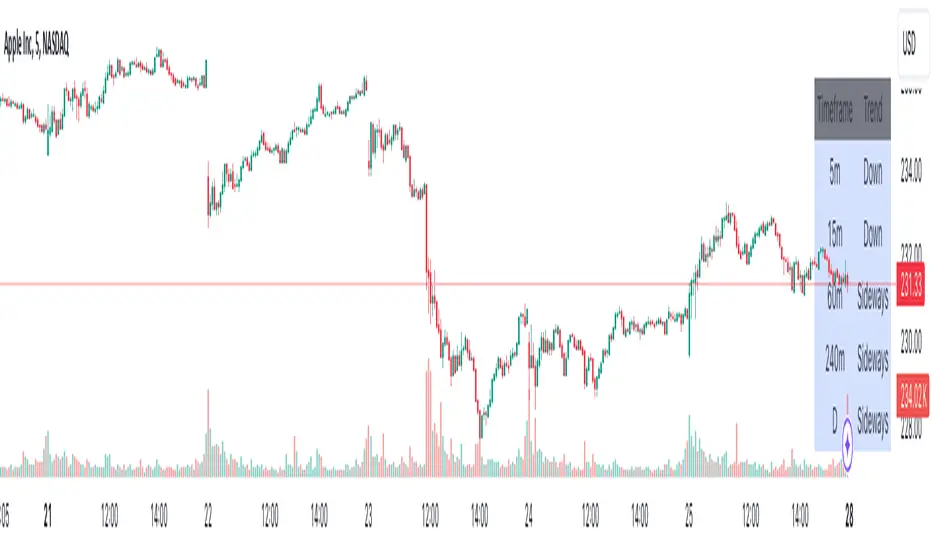
Table Creation:
A table is created at the bottom right of the chart to display the trend for different timeframes (5m, 15m, 60m, 240m, and Daily).
The table is initialized with headers and then populated with the trend results for each timeframe.
Calculating Trends for Each Timeframe:
The script fetches the current and previous close prices for each timeframe using request.security().
It calculates the RSI for each timeframe and then calls the trendDirection function to determine the trend.
Displaying Trends:
The results are displayed in a table format, with each timeframe and its corresponding trend.
Summary
Overall, this script provides a concise way to visualize market trends across multiple timeframes, using MAs and RSI to offer a more nuanced view of potential market movements. This can help traders make more informed decisions based on the prevailing trends.
Key Components of the Script
Inputs:
Moving Averages: Short and long moving average lengths (9 and 21 periods).
ATR and RSI Lengths: ATR (Average True Range) and RSI (Relative Strength Index) lengths set to 14 periods.
RSI Levels: Overbought and oversold levels for the RSI set to 70 and 30, respectively.
Trend Determination:
A function called trendDirection evaluates the trend based on the closing prices of the current and previous periods, as well as the RSI value.
It classifies the trend as "Up", "Down", or "Sideways" based on the conditions:
Up: Current close is higher than the previous close and RSI is below the overbought level.
Down: Current close is lower than the previous close and RSI is above the oversold level.
Sideways: If neither condition is met.
Table Creation:
A table is created at the bottom right of the chart to display the trend for different timeframes (5m, 15m, 60m, 240m, and Daily).
The table is initialized with headers and then populated with the trend results for each timeframe.
Calculating Trends for Each Timeframe:
The script fetches the current and previous close prices for each timeframe using request.security().
It calculates the RSI for each timeframe and then calls the trendDirection function to determine the trend.
Displaying Trends:
The results are displayed in a table format, with each timeframe and its corresponding trend.
Summary
Overall, this script provides a concise way to visualize market trends across multiple timeframes, using MAs and RSI to offer a more nuanced view of potential market movements. This can help traders make more informed decisions based on the prevailing trends.
Skrip sumber terbuka
Dalam semangat TradingView sebenar, pencipta skrip ini telah menjadikannya sumber terbuka, jadi pedagang boleh menilai dan mengesahkan kefungsiannya. Terima kasih kepada penulis! Walaupuan anda boleh menggunakan secara percuma, ingat bahawa penerbitan semula kod ini tertakluk kepada Peraturan Dalaman.
Penafian
Maklumat dan penerbitan adalah tidak bertujuan, dan tidak membentuk, nasihat atau cadangan kewangan, pelaburan, dagangan atau jenis lain yang diberikan atau disahkan oleh TradingView. Baca lebih dalam Terma Penggunaan.