OPEN-SOURCE SCRIPT
Telah dikemas kini M2 Global Liquidity Index - X Days Lead

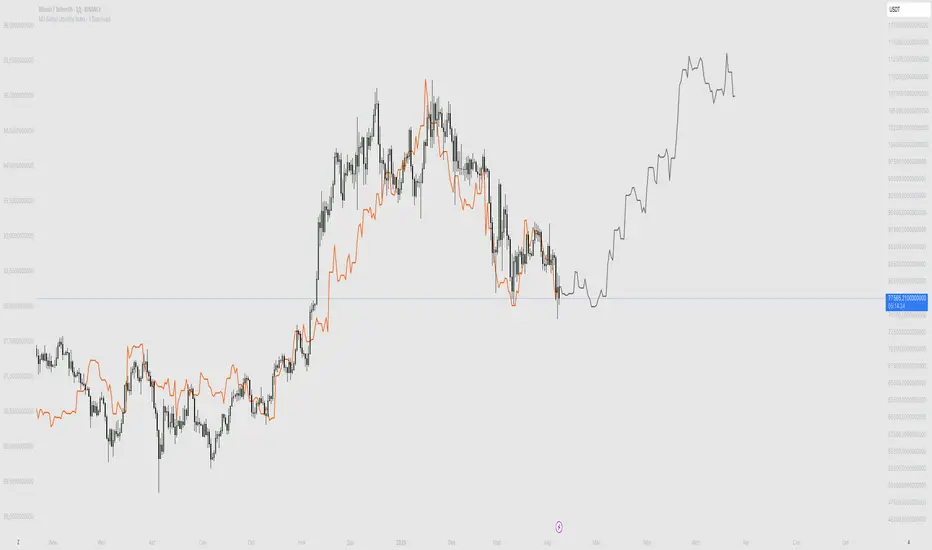
This custom indicator overlays the Bitcoin price chart with the Global Liquidity M2 chart, providing a unique perspective on how monetary supply might influence Bitcoin's price movements. The indicator distinguishes between past and future segments of the liquidity data using two distinct colors.
- Past Segment: The portion of the Global Liquidity M2 chart that has already passed is displayed in one color, allowing users to assess historical correlations with Bitcoin's price.
- Future Segment: The upcoming part of the liquidity chart is shown in a different color, offering insights into potential future impacts on Bitcoin's price trajectory.
by walkin
Nota Keluaran
This custom indicator overlays the Bitcoin price chart with the Global Liquidity M2 chart, providing a unique perspective on how monetary supply might influence Bitcoin's price movements. The indicator distinguishes between past and future segments of the liquidity data using two distinct colors.- Past Segment: The portion of the Global Liquidity M2 chart that has already passed is displayed in one color, allowing users to assess historical correlations with Bitcoin's price.
- Future Segment: The upcoming part of the liquidity chart is shown in a different color, offering insights into potential future impacts on Bitcoin's price trajectory.
by walkin
Skrip sumber terbuka
Dalam semangat TradingView sebenar, pencipta skrip ini telah menjadikannya sumber terbuka, jadi pedagang boleh menilai dan mengesahkan kefungsiannya. Terima kasih kepada penulis! Walaupuan anda boleh menggunakan secara percuma, ingat bahawa penerbitan semula kod ini tertakluk kepada Peraturan Dalaman.
Penafian
Maklumat dan penerbitan adalah tidak bertujuan, dan tidak membentuk, nasihat atau cadangan kewangan, pelaburan, dagangan atau jenis lain yang diberikan atau disahkan oleh TradingView. Baca lebih dalam Terma Penggunaan.