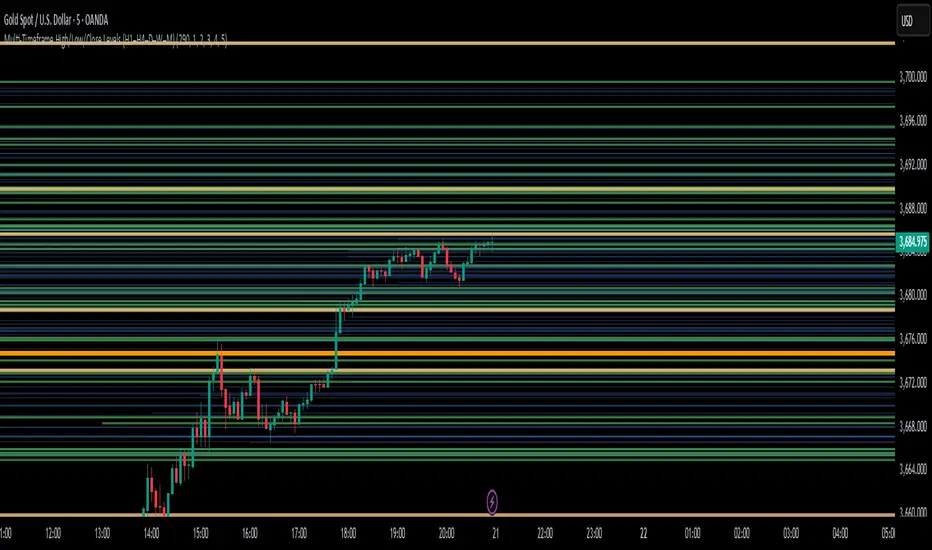
Multi-Timeframe High/Low/Close Levels (H1–H4–D–W–M)
H1 (1-Hour)
H4 (4-Hour)
Daily (1-Day)
Weekly (1-Week)
Monthly (1-Month)
Key Features:
Draws High, Low, and Close levels for each timeframe.
Each level starts from its own candle and extends to the right.
Levels are filtered to stay close to the current price, keeping the chart clean.
Automatic line management ensures that the total number of levels never exceeds the user-defined limit (default: 300, adjustable up to 400).
Customizable colors, widths, and visibility for each timeframe in the Style tab.
Usage:
Use these levels as dynamic support and resistance zones.
Higher-timeframe levels are drawn with stronger colors and thicker lines, giving visual priority over lower-timeframe levels.
Skrip jemputan sahaja
Hanya pengguna disahkan oleh penulis boleh mengakses skrip ini. Anda perlu memohon dan mendapatkan kebenaran untuk menggunakannya. Keizinan selalunya diberikan selepas pembayaran. Untuk lebih butiran, ikuti arahan penulis di bawah atau hubungi Vahid_Sehat secara terus.
TradingView TIDAK menyarankan pembayaran atau penggunaan skrip kecuali anda mempercayai sepenuhnya penulis dan memahami bagaimana ia berfungsi. Anda juga boleh menjumpai alternatif sumber terbuka dan percuma yang lain di dalam skrip komuniti kami.
Arahan penulis
Penafian
Skrip jemputan sahaja
Hanya pengguna disahkan oleh penulis boleh mengakses skrip ini. Anda perlu memohon dan mendapatkan kebenaran untuk menggunakannya. Keizinan selalunya diberikan selepas pembayaran. Untuk lebih butiran, ikuti arahan penulis di bawah atau hubungi Vahid_Sehat secara terus.
TradingView TIDAK menyarankan pembayaran atau penggunaan skrip kecuali anda mempercayai sepenuhnya penulis dan memahami bagaimana ia berfungsi. Anda juga boleh menjumpai alternatif sumber terbuka dan percuma yang lain di dalam skrip komuniti kami.