OPEN-SOURCE SCRIPT
Ehlers Regime Dynamic Candles
Core Calculation Mechanism
The indicator uses advanced Ehlers signal processing techniques to identify market regimes and create dynamically colored candles that reflect market conditions.
Super Smoother Filter: Price data (open, high, low, close) is processed through an Ehlers Super Smoother Filter to reduce market noise while preserving important price movements. This creates a clearer signal for regime detection.
Autocorrelation Analysis: The core of regime detection uses autocorrelation functions at different lag periods:
Primary autocorrelation measures correlation between the current price and its previous value
Trending autocorrelation measures longer-term persistence in the data series
These values combined determine if the market is in a trending or choppy regime

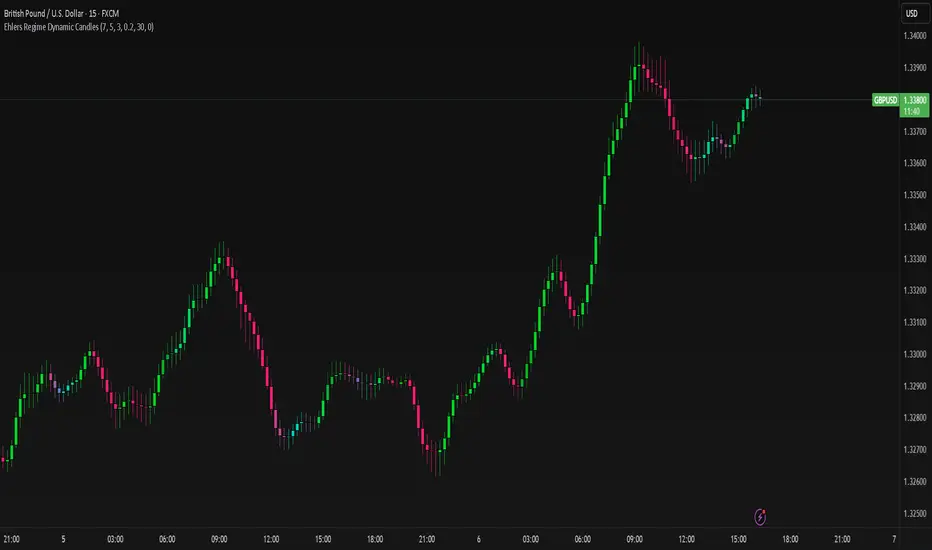
(Image showing Ehlers custom candles vs default candlesticks)
Regime Strength Calculation:
-Raw signal from autocorrelation with user-defined threshold adjustment
-Adaptive scaling based on sensitivity parameter
-Optional volume validation that confirms signal strength using volume data
-Normalization to 0-1 range and smoothing for visual consistency
-Percentile ranking to provide contextually meaningful strength values
Fisher Transform: Applied to the smoothed price to identify statistical extremes, which helps adjust transparency levels during significant price movements.
Key Features & Components
Regime Detection: Identifies trending vs. choppy market conditions using Ehlers' autocorrelation techniques.
Dynamic Candle Coloring: Candles transition smoothly between three color states:
Bullish trending (typically green/teal)
Bearish trending (typically red/purple)
Choppy/neutral (typically blue/silver)
Volume Validation: Optional incorporation of volume data to confirm trend strength (stronger volume during trending periods increases confidence).
Adaptive Transparency: Candles become more opaque during statistically significant price movements based on Fisher Transform values.
Gradient Smoothing: Controls the visual transition between regime states for a more aesthetically pleasing appearance.
Customizable Colors and Style: Full control over all visual aspects including candle body/wick colors and transparency.
Configuration Options
Users can adjust the following parameters in the indicator settings:
Main Settings:
Cycle Length: Controls the lookback period for cycle detection. Lower values increase responsiveness but may introduce noise.
Gradient Smoothness: Determines how quickly colors transition when regime changes.
Trend Detection Threshold: Sets the autocorrelation strength required to classify a trend.
Trend Sensitivity: Scales regime strength calculation to produce a better distribution of values.
Use Volume: Toggles whether volume data is used to validate trend strength.
Color Settings:
Trending Regime Colors: Separate color options for bullish and bearish candle bodies and wicks.
Choppy Regime Colors: Color options for candle bodies and wicks during sideways/neutral markets.
Style Settings:
Candle Border Options: Toggle borders and adjust their color and transparency.
Adaptive Transparency: Enable/disable dynamic transparency based on statistical significance.
Base Transparency: Set the baseline transparency level for all candles.
Interpretation Notes
Color Transitions: As the market shifts between regimes, candle colors gradually transition, providing visual cues about market structure changes.
Regime Strength: The intensity of colors indicates the strength of the detected regime:
Strong trending regimes show vibrant trending colors
Weak or mixed regimes display colors closer to the choppy/neutral color
Transitions between regimes show gradient colors
Transparency Changes: More opaque candles indicate statistically significant price movements, while more transparent candles suggest routine or less significant price action.
Volume Interaction: When volume validation is enabled, trending colors become more pronounced during high volume trends and subdued during low volume periods.
Disclaimer: These are custom candles that are significantly different from normal candlesticks.
Unlike traditional candlesticks that display raw price data, these candles:
• Use Ehlers signal processing to filter and smooth price data
• Dynamically change color based on detected market regimes
• Show statistical significance through transparency
• May appear delayed compared to standard candles due to the filtering process
Traditional trading strategies dependent on candlestick patterns will not work with these.
Risk Disclaimer
Trading involves significant risk. This indicator is provided for analytical purposes only and does not constitute financial advice. Past performance is not indicative of future results. Use sound risk management practices and never trade with capital you cannot afford to lose. The Ehlers Regime Dynamic Candles indicator should be used as part of a comprehensive trading approach, not as a standalone trading system.
The indicator uses advanced Ehlers signal processing techniques to identify market regimes and create dynamically colored candles that reflect market conditions.
Super Smoother Filter: Price data (open, high, low, close) is processed through an Ehlers Super Smoother Filter to reduce market noise while preserving important price movements. This creates a clearer signal for regime detection.
Autocorrelation Analysis: The core of regime detection uses autocorrelation functions at different lag periods:
Primary autocorrelation measures correlation between the current price and its previous value
Trending autocorrelation measures longer-term persistence in the data series
These values combined determine if the market is in a trending or choppy regime
(Image showing Ehlers custom candles vs default candlesticks)
Regime Strength Calculation:
-Raw signal from autocorrelation with user-defined threshold adjustment
-Adaptive scaling based on sensitivity parameter
-Optional volume validation that confirms signal strength using volume data
-Normalization to 0-1 range and smoothing for visual consistency
-Percentile ranking to provide contextually meaningful strength values
Fisher Transform: Applied to the smoothed price to identify statistical extremes, which helps adjust transparency levels during significant price movements.
Key Features & Components
Regime Detection: Identifies trending vs. choppy market conditions using Ehlers' autocorrelation techniques.
Dynamic Candle Coloring: Candles transition smoothly between three color states:
Bullish trending (typically green/teal)
Bearish trending (typically red/purple)
Choppy/neutral (typically blue/silver)
Volume Validation: Optional incorporation of volume data to confirm trend strength (stronger volume during trending periods increases confidence).
Adaptive Transparency: Candles become more opaque during statistically significant price movements based on Fisher Transform values.
Gradient Smoothing: Controls the visual transition between regime states for a more aesthetically pleasing appearance.
Customizable Colors and Style: Full control over all visual aspects including candle body/wick colors and transparency.
Configuration Options
Users can adjust the following parameters in the indicator settings:
Main Settings:
Cycle Length: Controls the lookback period for cycle detection. Lower values increase responsiveness but may introduce noise.
Gradient Smoothness: Determines how quickly colors transition when regime changes.
Trend Detection Threshold: Sets the autocorrelation strength required to classify a trend.
Trend Sensitivity: Scales regime strength calculation to produce a better distribution of values.
Use Volume: Toggles whether volume data is used to validate trend strength.
Color Settings:
Trending Regime Colors: Separate color options for bullish and bearish candle bodies and wicks.
Choppy Regime Colors: Color options for candle bodies and wicks during sideways/neutral markets.
Style Settings:
Candle Border Options: Toggle borders and adjust their color and transparency.
Adaptive Transparency: Enable/disable dynamic transparency based on statistical significance.
Base Transparency: Set the baseline transparency level for all candles.
Interpretation Notes
Color Transitions: As the market shifts between regimes, candle colors gradually transition, providing visual cues about market structure changes.
Regime Strength: The intensity of colors indicates the strength of the detected regime:
Strong trending regimes show vibrant trending colors
Weak or mixed regimes display colors closer to the choppy/neutral color
Transitions between regimes show gradient colors
Transparency Changes: More opaque candles indicate statistically significant price movements, while more transparent candles suggest routine or less significant price action.
Volume Interaction: When volume validation is enabled, trending colors become more pronounced during high volume trends and subdued during low volume periods.
Disclaimer: These are custom candles that are significantly different from normal candlesticks.
Unlike traditional candlesticks that display raw price data, these candles:
• Use Ehlers signal processing to filter and smooth price data
• Dynamically change color based on detected market regimes
• Show statistical significance through transparency
• May appear delayed compared to standard candles due to the filtering process
Traditional trading strategies dependent on candlestick patterns will not work with these.
Risk Disclaimer
Trading involves significant risk. This indicator is provided for analytical purposes only and does not constitute financial advice. Past performance is not indicative of future results. Use sound risk management practices and never trade with capital you cannot afford to lose. The Ehlers Regime Dynamic Candles indicator should be used as part of a comprehensive trading approach, not as a standalone trading system.
Skrip sumber terbuka
Dalam semangat TradingView sebenar, pencipta skrip ini telah menjadikannya sumber terbuka, jadi pedagang boleh menilai dan mengesahkan kefungsiannya. Terima kasih kepada penulis! Walaupuan anda boleh menggunakan secara percuma, ingat bahawa penerbitan semula kod ini tertakluk kepada Peraturan Dalaman.
Get access to premium indicators here:
whop.com/velowaveindicator
whop.com/velowaveindicator
Penafian
Maklumat dan penerbitan adalah tidak bertujuan, dan tidak membentuk, nasihat atau cadangan kewangan, pelaburan, dagangan atau jenis lain yang diberikan atau disahkan oleh TradingView. Baca lebih dalam Terma Penggunaan.