OPEN-SOURCE SCRIPT
MACD Histogram Multi-Timeframe
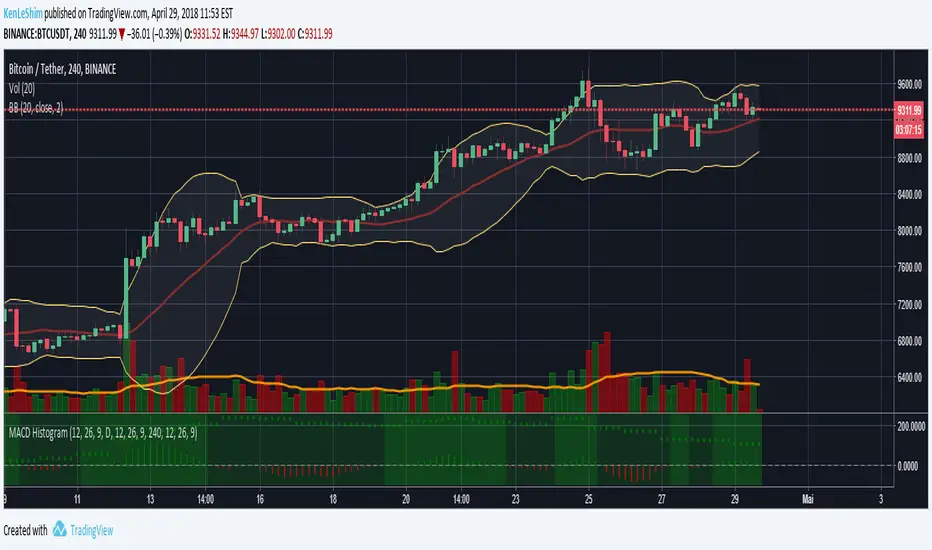
The MACD-Histogram represents the difference between the MACD (i.e., the between the two EMAs) and the signal line (i.e., the 9-day EMA of the MACD). The histogram is positive (i.e., above the zero line) when the MACD is above the signal line and negative when the MACD is below the signal line.
HOW IS IT USED ?
A bullish crossover occurs when the MACD histogram is negative and a bearish cross over occurs when the MACD histogram is negative.
I added the possibility to add on the chart a 2nd timeframe for confirmation.
If you found this script useful, a tip is always welcome... :)
HOW IS IT USED ?
A bullish crossover occurs when the MACD histogram is negative and a bearish cross over occurs when the MACD histogram is negative.
I added the possibility to add on the chart a 2nd timeframe for confirmation.
If you found this script useful, a tip is always welcome... :)
Skrip sumber terbuka
Dalam semangat TradingView sebenar, pencipta skrip ini telah menjadikannya sumber terbuka, jadi pedagang boleh menilai dan mengesahkan kefungsiannya. Terima kasih kepada penulis! Walaupuan anda boleh menggunakan secara percuma, ingat bahawa penerbitan semula kod ini tertakluk kepada Peraturan Dalaman.
Penafian
Maklumat dan penerbitan adalah tidak bertujuan, dan tidak membentuk, nasihat atau cadangan kewangan, pelaburan, dagangan atau jenis lain yang diberikan atau disahkan oleh TradingView. Baca lebih dalam Terma Penggunaan.