OPEN-SOURCE SCRIPT
Bostian Intraday Intensity Index (BII)
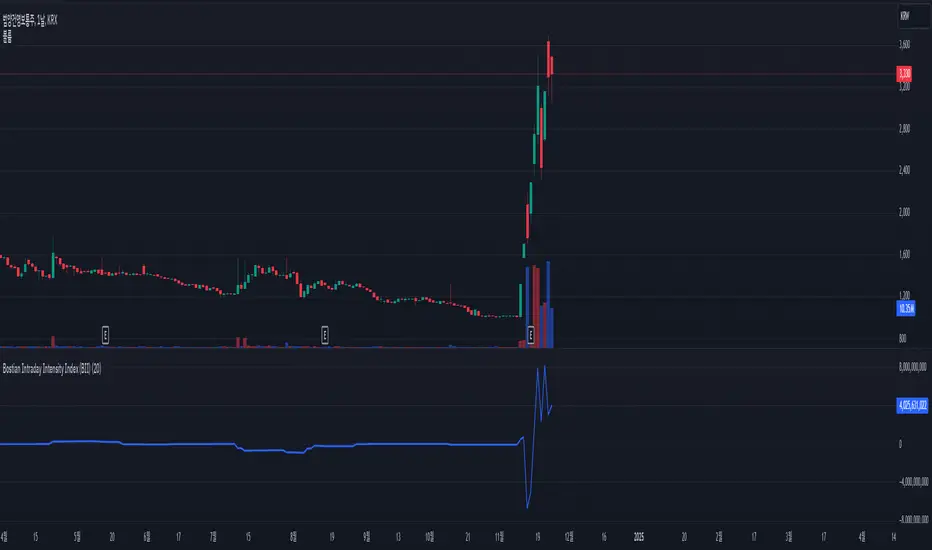
The Bostian Intraday Intensity Index (BII) is a metric used to analyze the trading volume and price movements of a specific stock or asset, measuring the strength and pressure of the market. BII captures buy and sell signals by examining the relationship between trading volume and price fluctuations. Below is an explanation of the key components and calculation method for BII:
○ BII Formula:
sum(V*((C-L)^2-(H-C)^2))/(H-L)))
○ Meaning of the Indicator:
○ How to Use:
The BII indicator is useful for analyzing the strength and pressure of the market through the correlation of price movements and trading volume. It helps investors capture buy and sell signals to make better investment decisions.
○ BII Formula:
sum(V*((C-L)^2-(H-C)^2))/(H-L)))
- V (Volume): Trading volume
- C (Close): Closing price
- L (Low): Lowest price
- H (High): Highest price
○ Meaning of the Indicator:
- Positive Values: When BII is positive, it indicates strong buying pressure. The closer the closing price is to the high, the stronger the buying pressure.
- Negative Values: When BII is negative, it indicates strong selling pressure. The closer the closing price is to the low, the stronger the selling pressure.
○ How to Use:
- Buy Signal: When the BII value is positive and trending upwards, it may be considered a buying opportunity.
- Sell Signal: When the BII value is negative and trending downwards, it may be considered a selling opportunity.
The BII indicator is useful for analyzing the strength and pressure of the market through the correlation of price movements and trading volume. It helps investors capture buy and sell signals to make better investment decisions.
Skrip sumber terbuka
Dalam semangat TradingView sebenar, pencipta skrip ini telah menjadikannya sumber terbuka, jadi pedagang boleh menilai dan mengesahkan kefungsiannya. Terima kasih kepada penulis! Walaupuan anda boleh menggunakan secara percuma, ingat bahawa penerbitan semula kod ini tertakluk kepada Peraturan Dalaman.
Penafian
Maklumat dan penerbitan adalah tidak bertujuan, dan tidak membentuk, nasihat atau cadangan kewangan, pelaburan, dagangan atau jenis lain yang diberikan atau disahkan oleh TradingView. Baca lebih dalam Terma Penggunaan.