OPEN-SOURCE SCRIPT
Telah dikemas kini Bollinger Band Volatility Spread Visualizer
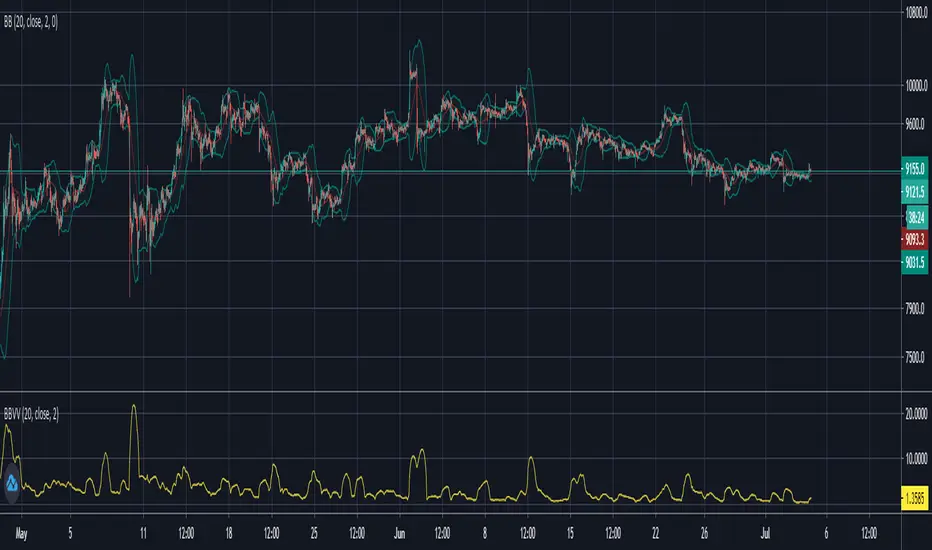
This indicator was created to see the total dollar (or whatever currency pair) amount spread between the upper and lower Bollinger Bands. This knowledge of knowing this spread can be used to indicate upcoming periods of high volatility in a market. The fundamental idea behind predicting periods of high volatility is backed up by the idea that periods of low volatility are followed by periods of high volatility and vice versa.
Based on this knowledge, the numerical spread of the Bollinger Bands, as shown in the indicator, we can deduce that when the value is super low, we can expect a period of high volatility AKA: big move incoming.
This indicator is not fully finished because this was my first time coding in Pinescript and I wanted to post the basic indicator first.
My future plans for improving this indicator include:
- Adding customization as an option to choose your personal BBands settings that this indicator is based off of
- Potentially converting this indicator as a TradingView Strategy where a signal would go off when the spread reaches a certain threshold
Nota Keluaran
Added code for custom Bollinger Bands input for flexibility for everyone's different uses of Bollinger BandsNota Keluaran
Changed the way the data is presented by indexing the spread of the Bollinger Bands relative to the price of the asset. Basically just used the Bollinger Bands Width function that already exists and multiplied by 100 to get more precision. My eventual goal is to figure out a threshold that when reached, creates a general signal of upcoming high volatility. That signal can then be used in conjunction with other indicators (to detect the direction of a trend) to create a buy or sell signal.
Skrip sumber terbuka
Dalam semangat TradingView sebenar, pencipta skrip ini telah menjadikannya sumber terbuka, jadi pedagang boleh menilai dan mengesahkan kefungsiannya. Terima kasih kepada penulis! Walaupuan anda boleh menggunakan secara percuma, ingat bahawa penerbitan semula kod ini tertakluk kepada Peraturan Dalaman.
Penafian
Maklumat dan penerbitan adalah tidak bertujuan, dan tidak membentuk, nasihat atau cadangan kewangan, pelaburan, dagangan atau jenis lain yang diberikan atau disahkan oleh TradingView. Baca lebih dalam Terma Penggunaan.