OPEN-SOURCE SCRIPT
Telah dikemas kini ETF Leverage Verification
Do leveraged ETFs really return what they promise?
Do they return the exact 2x or 3x? Or a slightly different multiple?
How much do they deviate from the promised leverage multiples?
Do these deviations impact investors in a positive or negative manner?
These are the questions that I want to answer with this indicator.
The ETF Leverage Verification indicator challenges the conventional understanding of leveraged ETFs by measuring how they actually perform versus their theoretical targets.
Instead of assuming leveraged ETFs perfectly track their target multiple, this indicator quantifies the real-world behavior by comparing the expected returns versus the actual results on every trading day.
Key Features
How to Use the Indicator
Understanding the Results
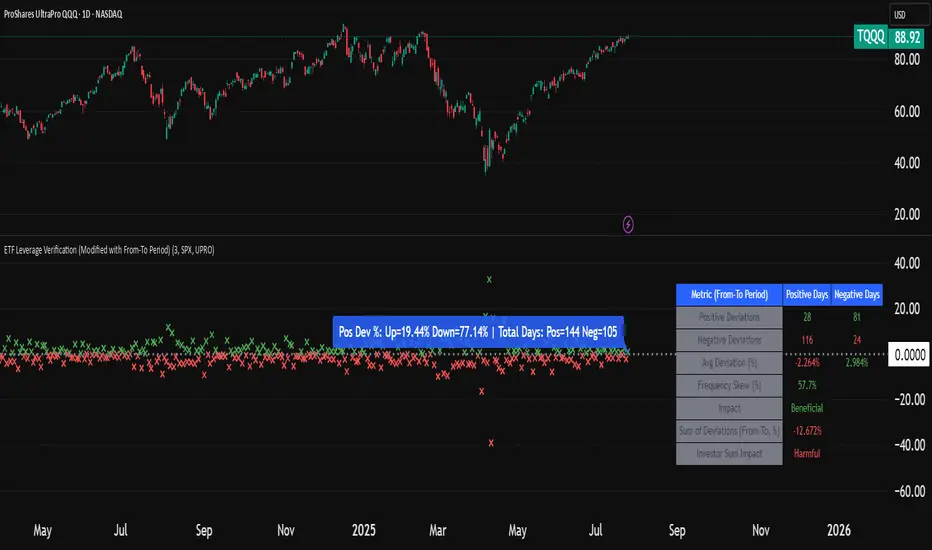
Green markers: Days when the ETF outperformed its expected multiple
Red markers: Days when the ETF underperformed its expected multiple
Data Table:
Positive Deviations: Count of days with better-than-expected performance
Negative Deviations: Count of days with worse-than-expected performance
Avg Deviation: Average magnitude of deviation from expected returns
Frequency Skew: Difference between beneficial deviations in down vs. up markets
Impact: Overall assessment of pattern benefit to investors
Summary Label:
Percentage of positive deviations in up and down markets
Total sample size for statistical significance
Key Patterns to Look For
Positive Deviation in Negative Days:
This occurs when a leveraged ETF falls less than expected during market declines. For example, if SPX falls 1% and a 2x ETF falls only 1.8% (instead of the expected 2%), this creates a +0.2% deviation. This pattern is beneficial as it provides downside protection.
Negative Deviation in Positive Days:
This happens when a leveraged ETF rises less than expected during market advances. For example, if SPX rises 1% and a 2x ETF rises only 1.9% (instead of the expected 2%), this creates a -0.1% deviation. This pattern reduces upside performance.
Frequency Skew:
The most critical metric that measures how much more frequently beneficial deviations occur in down markets compared to up markets. A higher positive skew indicates a stronger asymmetric pattern that helps long-term performance.
Mathematical Background
The indicator computes the deviation between expected and actual performance:
Deviation = Actual Return - Expected Return
Where:
Expected Return = Base Asset Return × Leverage Factor
The deviation is then categorized into four possible outcomes:
In short, more positive deviations are good for investors.
Please feel free to criticize. I'm happy to improve the indicator.
Do they return the exact 2x or 3x? Or a slightly different multiple?
How much do they deviate from the promised leverage multiples?
Do these deviations impact investors in a positive or negative manner?
These are the questions that I want to answer with this indicator.
The ETF Leverage Verification indicator challenges the conventional understanding of leveraged ETFs by measuring how they actually perform versus their theoretical targets.
Instead of assuming leveraged ETFs perfectly track their target multiple, this indicator quantifies the real-world behavior by comparing the expected returns versus the actual results on every trading day.
Key Features
- Measures actual versus expected performance of leveraged ETFs
- Tracks deviation patterns across thousands of trading days
- Identifies asymmetric behavior in up versus down markets
- Quantifies beneficial "cushioning effect" during market declines
- Provides statistical summary of performance patterns
- Works with any leverage factor (2x, 3x, -1x, etc.)
- Compatible with all leveraged ETFs (equity, bond, commodity, volatility)
How to Use the Indicator
- Enter the Expected Leverage Factor (default: 2.0)
- Select the Base Asset (underlying index, e.g., SPX)
- Select the Leveraged Asset (leveraged ETF, e.g., SSO)
Understanding the Results
Green markers: Days when the ETF outperformed its expected multiple
Red markers: Days when the ETF underperformed its expected multiple
Data Table:
Positive Deviations: Count of days with better-than-expected performance
Negative Deviations: Count of days with worse-than-expected performance
Avg Deviation: Average magnitude of deviation from expected returns
Frequency Skew: Difference between beneficial deviations in down vs. up markets
Impact: Overall assessment of pattern benefit to investors
Summary Label:
Percentage of positive deviations in up and down markets
Total sample size for statistical significance
Key Patterns to Look For
Positive Deviation in Negative Days:
This occurs when a leveraged ETF falls less than expected during market declines. For example, if SPX falls 1% and a 2x ETF falls only 1.8% (instead of the expected 2%), this creates a +0.2% deviation. This pattern is beneficial as it provides downside protection.
Negative Deviation in Positive Days:
This happens when a leveraged ETF rises less than expected during market advances. For example, if SPX rises 1% and a 2x ETF rises only 1.9% (instead of the expected 2%), this creates a -0.1% deviation. This pattern reduces upside performance.
Frequency Skew:
The most critical metric that measures how much more frequently beneficial deviations occur in down markets compared to up markets. A higher positive skew indicates a stronger asymmetric pattern that helps long-term performance.
Mathematical Background
The indicator computes the deviation between expected and actual performance:
Deviation = Actual Return - Expected Return
Where:
Expected Return = Base Asset Return × Leverage Factor
The deviation is then categorized into four possible outcomes:
- Positive deviation on positive market days
- Negative deviation on positive market days
- Positive deviation on negative market days
- Negative deviation on negative market days
In short, more positive deviations are good for investors.
Please feel free to criticize. I'm happy to improve the indicator.
Nota Keluaran
UPDATEThis update limits all calculations (deviation counts, totals, averages, percentages, and sums) to the user-specified "From" and "To" date range, replacing full-history accumulations for targeted analysis of leverage deviations.
I've also added sumDeviation to understand if these leveraged ETF deviations are beneficial for investors or not.
Key Changes:
- Date Restriction: Metrics accumulate only within startDate and endDate using an inPeriod check.
- Period-Specific Vars: Added prefixed variables (e.g., periodCountPosDay) for range-only tracking.
- Table/Label Updates: Header notes "(From-To Period)"; all values now use period-specific data.
- Sum Handling: sumDeviation only adds in-range deviations for focused investor impact (Beneficial if positive, Harmful if negative).
Notes: Ensure chart data covers the range; sparse periods may show 0/na. Backward-compatible.
Skrip sumber terbuka
Dalam semangat TradingView sebenar, pencipta skrip ini telah menjadikannya sumber terbuka, jadi pedagang boleh menilai dan mengesahkan kefungsiannya. Terima kasih kepada penulis! Walaupuan anda boleh menggunakan secara percuma, ingat bahawa penerbitan semula kod ini tertakluk kepada Peraturan Dalaman.
Penafian
Maklumat dan penerbitan adalah tidak bertujuan, dan tidak membentuk, nasihat atau cadangan kewangan, pelaburan, dagangan atau jenis lain yang diberikan atau disahkan oleh TradingView. Baca lebih dalam Terma Penggunaan.