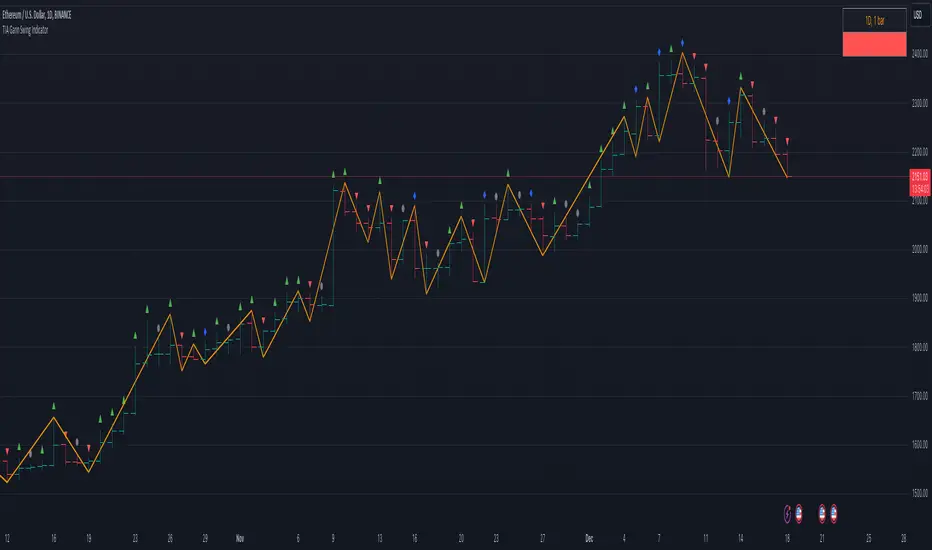
TIA Gann Swing Indicator
This indicator is a mechanical tool that tells the user exactly what the market trend is at any time, based on the teachings of Legendary trader, Mr. William D. Gann .
Gann called this tool the “Trendline Indicator,” but it has popularly become known as the “Swing Chart” by present-day traders.
In October 1909, Richard Wyckoff watched Gann for 25 market days (the markets traded on Saturdays back then), where Gann made 286 trades, both long and short. Two hundred sixty-four (264) of these trades were profits.
The Swing Chart was Gann’s primary trading tool helping him achieve these phenomenal trading results.
This indicator, now available to you in TradingView, automatically displays the swing chart and trend on any timeframe.
Selecting “Show Trend,” will light the background of the chart up, showing if the trend is “Up,” “Down,” or “Uncertain.”
The indicator is also fully customizable to display “Break Lines,” which indicate potential trend changes ahead of time.
Additional features include data about each bar and swing to give the user vital information, and the data points currently available include:
Bar Type
This indicator selection allows the user to identify precisely what each bar is, as per WD Gann’s Instructions.
Each of the 4 bar types includes:
Up bars, Down bars, Inside bars, Outside bars
Date
Displaying the date of swing tops and bottoms allows the user to stay on top of significant announcements and events in the economy. Often, market reversals occur right around critical economic events.
Time
This indicator selection allows the user to identify the time of the swing tops and swing bottoms. Designed for intra-day traders, this setting displays the exact time of tops and bottoms on any timeframe to help stay ahead of any important announcement.
Price
Price analysis is critical for every technical analyst, and displaying the price of swing tops and bottoms allows the trader or investor to stay on top of essential pivot points in the market. Identifying potential support and resistance levels keeps traders ahead of the herd.
Range
Identifying each swing’s price range gives the trader or investor critical information. Have you ever wondered if a market is gaining momentum or losing momentum? Knowing if price ranges are expanding or contracting is key, and this setting quickly displays what every swing range is doing.
Bar Count
What is the average number of bars up or down? Markets can only move in one direction for so many bars before a reversal. Simply displaying the number of bars between each swing gives the analyst valuable insights into overbought or oversold trends. Gann's famous “7-10 bar” rule identifies potential reversals, and this simple indicator setting can help any market participant stay ahead of the pack.
The TIA Gann Swing Indicator is an indicator that EVERY trader & investor should have at their fingertips. It is critical for long-term investors and short-term traders to know the trend of their market and vital information about the upswings and downswings. The TIA Gann Swing Indicator is the indicator to help.
See the Author's instructions below to get access to this package.
Projected swing break line.
Projected swing break line.
- Swing TOP break
- Swing BOTTOM break
- UP trend
- DOWN trend
- UNCERTAIN trend
Added auto decimal conversion for range and price labels.
Added auto unit conversion for range and price labels.
Two additional swing overlays that can be of 1 bar, 2 bar, or 3 bar type from the selected charts time frame or from a higher timer frame.
Trend confluence table of all enabled swing overlays.
- Bug fixes and improved stability.
When "Current Timeframe" is selected, your Swing Overlay will automatically update according to the time frame to which you have changed your chart.
For example, if you are on a 4-hour chart with a 4-hour 1 bar and 4-hour 2 bar swing overlay, when you change to a 1-day chart, your swing chart will automatically change to a 1-day 1 bar and 1-day 2 bar swing overlay.
Added option to select/deselect price compact notation for the swing top/ bottom price and price range.
Skrip jemputan sahaja
Hanya pengguna disahkan oleh penulis boleh mengakses skrip ini. Anda perlu memohon dan mendapatkan kebenaran untuk menggunakannya. Keizinan selalunya diberikan selepas pembayaran. Untuk lebih butiran, ikuti arahan penulis di bawah atau hubungi TIA_Technologies secara terus.
TradingView TIDAK menyarankan pembayaran atau penggunaan skrip kecuali anda mempercayai sepenuhnya penulis dan memahami bagaimana ia berfungsi. Anda juga boleh menjumpai alternatif sumber terbuka dan percuma yang lain di dalam skrip komuniti kami.
Arahan penulis
Penafian
Skrip jemputan sahaja
Hanya pengguna disahkan oleh penulis boleh mengakses skrip ini. Anda perlu memohon dan mendapatkan kebenaran untuk menggunakannya. Keizinan selalunya diberikan selepas pembayaran. Untuk lebih butiran, ikuti arahan penulis di bawah atau hubungi TIA_Technologies secara terus.
TradingView TIDAK menyarankan pembayaran atau penggunaan skrip kecuali anda mempercayai sepenuhnya penulis dan memahami bagaimana ia berfungsi. Anda juga boleh menjumpai alternatif sumber terbuka dan percuma yang lain di dalam skrip komuniti kami.