PROTECTED SOURCE SCRIPT
Telah dikemas kini 5-Day Moving Average - Intraday [LevelUp]

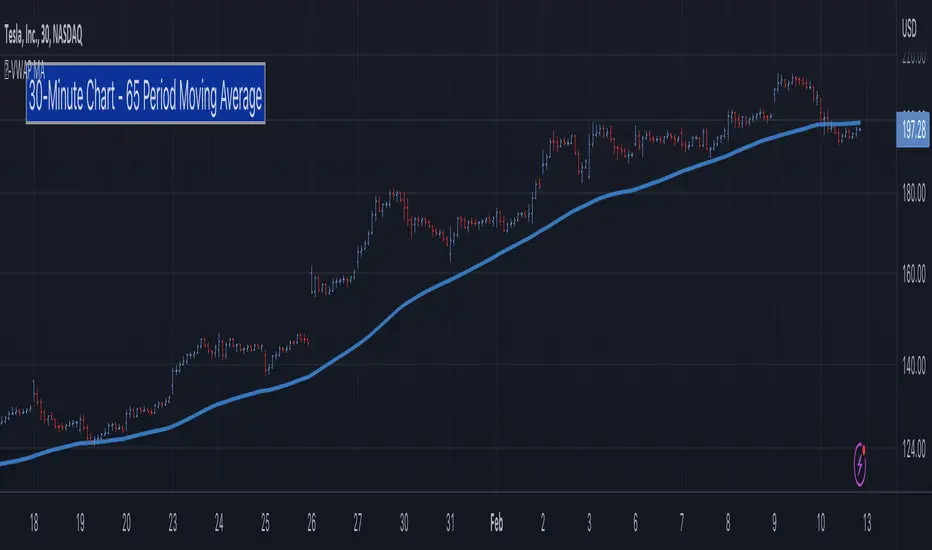
In collaboration with Brian Shannon, author of two best-selling books on technical analysis, we've put together an indicator that manages the moving average period based on the chart timeframe.
When using AVWAP as described by Brian, we look for stocks where the trend of the 50-SMA is higher. In that scenario, we look to shorter timeframes (intraday charts) to see if the price action is setting up for a low risk trade. We do this by making sure the shorter timeframe(s) align with the longer. As we look at various timeframes, we need to make sure the moving average is consistent across the timeframes, which is done via the 5-day moving average as outlined below.
The 5-Day Moving Average (5-DMA)
Brian explains it best, from his article 5 Day Moving Average posted on his blog:
"If you want to see a five DAY moving average on a chart with 10 minute candles, you have to consider how many 10 minute periods of trading there are in the trading day. The US equities markets are open from 9:30- 4:00 each day, which is 6.5 hours per trading day. In each hour of trading, there are 6-10 minute periods, so during the regular session for equities, the market is open for 390 minutes or 39-10 minute periods per day. If we are to get a five day moving average, we would take the 39-10 minute periods the market is open each day and then multiply that by five days. 39 x 5 = 195. So a 5 DAY moving average is represented by a 195 PERIOD moving average when looking at a 10 minute timeframe."
Here are the supported timeframes and their 5-DMA equivalents:
1-minute 1950
2-minutes 975
3-minutes 650
5-minutes 390
6-minutes 325
10-minutes 195
13-minutes 150
15-minutes 130
26-minutes 75
30-minutes 65
39-minutes 50
65-minutes 30
78-minutes 25
130-minutes 15
195-minutes 10

More Information About Anchored VWAP (AVWAP)
Brian goes into great detail about multiple timeframe analysis and AVWAP in both of his books:
▪ Maximum Trading Gains With Anchored VWAP
▪ Technical Analysis Using Multiple Timeframes
Acknowledgements
Many thanks to Brian Shannon for sharing his expertise on Anchored VWAP and providing feedback and suggestions during the development of the indicator.
When using AVWAP as described by Brian, we look for stocks where the trend of the 50-SMA is higher. In that scenario, we look to shorter timeframes (intraday charts) to see if the price action is setting up for a low risk trade. We do this by making sure the shorter timeframe(s) align with the longer. As we look at various timeframes, we need to make sure the moving average is consistent across the timeframes, which is done via the 5-day moving average as outlined below.
The 5-Day Moving Average (5-DMA)
Brian explains it best, from his article 5 Day Moving Average posted on his blog:
"If you want to see a five DAY moving average on a chart with 10 minute candles, you have to consider how many 10 minute periods of trading there are in the trading day. The US equities markets are open from 9:30- 4:00 each day, which is 6.5 hours per trading day. In each hour of trading, there are 6-10 minute periods, so during the regular session for equities, the market is open for 390 minutes or 39-10 minute periods per day. If we are to get a five day moving average, we would take the 39-10 minute periods the market is open each day and then multiply that by five days. 39 x 5 = 195. So a 5 DAY moving average is represented by a 195 PERIOD moving average when looking at a 10 minute timeframe."
Here are the supported timeframes and their 5-DMA equivalents:
1-minute 1950
2-minutes 975
3-minutes 650
5-minutes 390
6-minutes 325
10-minutes 195
13-minutes 150
15-minutes 130
26-minutes 75
30-minutes 65
39-minutes 50
65-minutes 30
78-minutes 25
130-minutes 15
195-minutes 10
More Information About Anchored VWAP (AVWAP)
Brian goes into great detail about multiple timeframe analysis and AVWAP in both of his books:
▪ Maximum Trading Gains With Anchored VWAP
▪ Technical Analysis Using Multiple Timeframes
Acknowledgements
Many thanks to Brian Shannon for sharing his expertise on Anchored VWAP and providing feedback and suggestions during the development of the indicator.
Nota Keluaran
Release Notes: Version 2.0▪ Added support for any market traded around the world.
▪ Added an optional table that shows the chart timeframe and the relevant moving average.
The default number of minutes in the indicator is set to 390 as the U.S. market is open for 6.5 hours per trading day. If you are trading a different market, enter the total minutes per trading day in Settings. For example, if trading the Indian Market, there are 375 minutes per trading day.
Nota Keluaran
Version 3.0▪ Optional table stats are now shown only on an intraday chart.
Nota Keluaran
Version 4.0▪ Added option to auto-detect crypto or futures and adjust the minutes in trading day accordingly.
Nota Keluaran
Version 4.1▪ Updated the indicator name shown on the chart.
Nota Keluaran
Version 4.2▪ Adjustment to the naming convention for all LevelUp^ indicators.
Skrip dilindungi
Skrip ini diterbitkan sebagai sumber tertutup. Akan tetapi, anda boleh menggunakannya secara bebas dan tanpa apa-apa had – ketahui lebih di sini.
Join traders in over 40 countries and LevelUp!
tradingview.com/spaces/LevelUpTools/
tradingview.com/spaces/LevelUpTools/
Penafian
Maklumat dan penerbitan adalah tidak bertujuan, dan tidak membentuk, nasihat atau cadangan kewangan, pelaburan, dagangan atau jenis lain yang diberikan atau disahkan oleh TradingView. Baca lebih dalam Terma Penggunaan.