PROTECTED SOURCE SCRIPT
Celestial Cycles [Orderflowing]
Astronomical Calculations | Moon Phases | Lunar Cycles & Rare Events | Solar Eclipses & Seasonal Markers | Mercury Retrograde Analysis | Momentum-Based Trend Coloration | Moon Information Table | Customizable Alerts
Built using Pine Script V6
Introduction
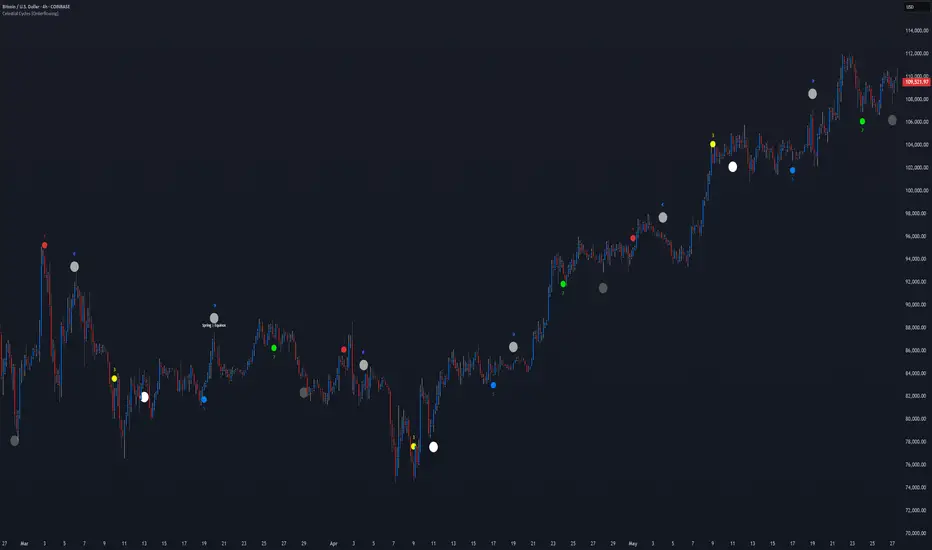
The Celestial Cycles indicator is a simple yet complex script that merges the timeless influence of astronomical events with modern technical analysis. By plotting key celestial phenomena, such as moon phases, seasonal markers, and Mercury retrograde periods onto your price chart, this indicator offers traders a fresh perspective on market cycles.
If you like financial astrology or seeking a creative edge, it provides a visually intuitive way to explore potential correlations between celestial events and market behavior.
This indicator is ideal for traders of all experience levels looking to integrate the celestial cycle into their strategies, complementing traditional technical tools with a unique layer of analysis.
Innovation and Inspiration
Inspired by financial astrology. The notion that celestial events, like moon phases or planetary retrogrades, might influence human psychology and market dynamics has intrigued traders for a long time. "Millionaires don’t use astrology, billionaires do." (allegedly): ~J.P. Morgan
This indicator modernizes that concept with astronomical calculations, plotting these events on your chart.
Core Features
Customization and User Inputs
Celestial Cycles is customizable, allowing you to adjust it to your liking:
These options ensure a clean, focused chart highlighting only the elements most relevant to your analysis.
How It Works
The indicator leverages code to show celestial events:
Analysis and Interpretation
Traders can use Celestial Cycles to explore intriguing market hypotheses:
Usage and Applications
Why Use This Indicator?
Conclusion
Celestial Cycles is an exploration of how the cosmos might intersect with the markets. By overlaying key astronomical events on your chart and offering alerts, it invites you to see trading through a new lens. While not a crystal ball, it’s a compelling addition to a trader’s toolkit.
Disclaimer: This indicator is for informational, educational and analytical purposes only. Celestial correlations are speculative and should not be the sole basis for trading decisions. Always combine with other analysis methods and manage risk appropriately.
Built using Pine Script V6
Introduction
The Celestial Cycles indicator is a simple yet complex script that merges the timeless influence of astronomical events with modern technical analysis. By plotting key celestial phenomena, such as moon phases, seasonal markers, and Mercury retrograde periods onto your price chart, this indicator offers traders a fresh perspective on market cycles.
If you like financial astrology or seeking a creative edge, it provides a visually intuitive way to explore potential correlations between celestial events and market behavior.
This indicator is ideal for traders of all experience levels looking to integrate the celestial cycle into their strategies, complementing traditional technical tools with a unique layer of analysis.
Innovation and Inspiration
Inspired by financial astrology. The notion that celestial events, like moon phases or planetary retrogrades, might influence human psychology and market dynamics has intrigued traders for a long time. "Millionaires don’t use astrology, billionaires do." (allegedly): ~J.P. Morgan
This indicator modernizes that concept with astronomical calculations, plotting these events on your chart.
Core Features
- Moon Phases: Displays new moons, full moons, and quarter moons, with optional micro phases (1/8, 3/8, 5/8, 7/8) for detailed analysis.
- Special Moons: Highlights rare events like blood moons (lunar eclipses) and blue moons with distinct markers.
- Solar Eclipses: Marks solar eclipses during new moon phases when enabled.
- Seasonal Events: Plots "Spring | Equinox," "Summer | Solstice," "Autumn | Equinox," and "Winter | Solstice" for cyclical context.
- Mercury Retrograde: Visualizes current and future Mercury retrograde periods with background highlights and labels.
- Trend Coloration: Colors price bars based on momentum to aid trend visualization (optional).
- Information Table: Shows real-time moon age and phase details in a table.
- Customizable Alerts: Set up alerts for moon phases, special moon events, seasonal events, and Mercury retrograde transitions to stay informed about key celestial occurrences.
Customization and User Inputs
Celestial Cycles is customizable, allowing you to adjust it to your liking:
- Event Toggles: Show or hide specific events (e.g., moon phases, special moons, eclipses, seasonal events, Mercury retrograde).
- Visual Adjustments: Set colors and positions (above or below bars) for each event type.
- Phase Timing: Fine-tune moon phase detection with hour-based adjustments for precision.
- Trend Settings: Enable/disable trend coloration and adjust the momentum calculation period.
- Mercury Retrograde Options: Display current retrogrades and up to 10 future periods, with customizable visibility.
- Alert Settings: Enable or disable alerts for specific celestial events, including moon phases, special moons, seasonal events, and Mercury retrograde starts and ends.
These options ensure a clean, focused chart highlighting only the elements most relevant to your analysis.
How It Works
The indicator leverages code to show celestial events:
- Moon Phases: Calculated using Julian dates and ecliptic coordinates to determine moon age and phase transitions.
- Special Events: Detects eclipses and rare moons by analyzing lunar and solar positions relative to the ecliptic plane.
- Seasonal Markers: Identifies "Spring | Equinox," "Summer | Solstice," "Autumn | Equinox," and "Winter | Solstice".
- Mercury Retrograde: Approximates retrograde cycles and projects future periods based on a simplified orbital model.
- Trend Coloration: Applies a momentum oscillator to color bars, reflecting potential bullish or bearish trend.
Analysis and Interpretation
Traders can use Celestial Cycles to explore intriguing market hypotheses:
- Moon Phases: New and full moons may align with volatility spikes or trend reversals.
- Eclipses: Eclipses might signal significant market shifts.
- Seasonal Events: Equinoxes and solstices could highlight cyclical turning points.
- Mercury Retrograde: Periods of potential disruption or reversal, often linked to communication and technology challenges.
- Trend Coloration: Visual cues to confirm potential momentum alongside celestial events.
Usage and Applications
- Long-Term Trends: High Timeframe (HTF) charts to study celestial impacts on major cycles.
- Short-Term Trends: Apply to intraday timeframes (LTF) for event correlations.
- Confluence: Pair with technical indicators for stronger signals.
- Research: Backtest historical data to uncover patterns specific to your chosen market. Use the adjustment periods to fine-tune.
Why Use This Indicator?
- Unique Perspective: Combines celestial and technical analysis.
- Free Access: Enjoy a premium script with lots of features at no cost.
- Customization: Personalize every aspect to suit your preferences.
- Educational: Learn about astronomical cycles.
- Stay Informed: Set up customizable alerts to receive event notifications.
Conclusion
Celestial Cycles is an exploration of how the cosmos might intersect with the markets. By overlaying key astronomical events on your chart and offering alerts, it invites you to see trading through a new lens. While not a crystal ball, it’s a compelling addition to a trader’s toolkit.
Disclaimer: This indicator is for informational, educational and analytical purposes only. Celestial correlations are speculative and should not be the sole basis for trading decisions. Always combine with other analysis methods and manage risk appropriately.
Skrip dilindungi
Skrip ini diterbitkan sebagai sumber tertutup. Akan tetapi, anda boleh menggunakannya secara bebas dan tanpa apa-apa had – ketahui lebih di sini.
William | Orderflowing
Develop Edge For Markets™
Indicators:
tradingview.com/u/Orderflowing/
orderflowing.com/indicators
Get Instant Access: orderflowing.com/pricing
Develop Edge For Markets™
Indicators:
tradingview.com/u/Orderflowing/
orderflowing.com/indicators
Get Instant Access: orderflowing.com/pricing
Penafian
Maklumat dan penerbitan adalah tidak bertujuan, dan tidak membentuk, nasihat atau cadangan kewangan, pelaburan, dagangan atau jenis lain yang diberikan atau disahkan oleh TradingView. Baca lebih dalam Terma Penggunaan.