KD_RSI345
Modified: 2/12/2017
Description:
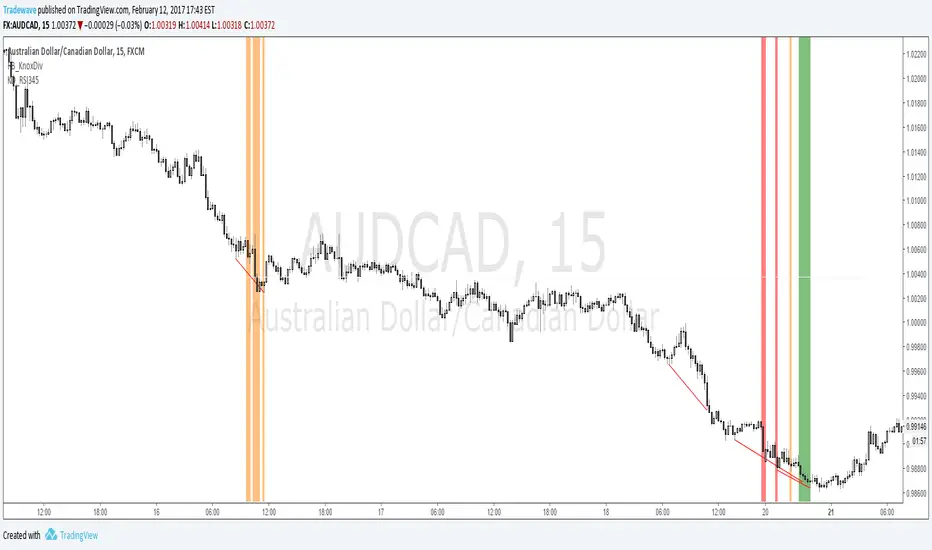
The indicator searches for instances where there is a Knoxville divergence combined with multiple time frame RSI Oversold/Overbought conditions.
When a bullish Knoxville Divergence (KD) is present and price is oversold across 3 time frames, within the KD bar range, a vertical green line is displayed on the chart.
When a bullish Knoxville Divergence (KD) is present and price is oversold across 4 time frames, within the KD bar range, a vertical orange line is displayed on the chart.
When a bullish Knoxville Divergence (KD) is present and price is oversold across 3 time frames, within the KD bar range, a vertical red line is displayed on the chart.
Same applies for Bearish Knoxville Divergence in overbought conditions.
Skrip jemputan sahaja
Hanya pengguna disahkan oleh penulis boleh mengakses skrip ini. Anda perlu memohon dan mendapatkan kebenaran untuk menggunakannya. Keizinan selalunya diberikan selepas pembayaran. Untuk lebih butiran, ikuti arahan penulis di bawah atau hubungi LiquidityTracker secara terus.
TradingView TIDAK menyarankan pembayaran atau penggunaan skrip kecuali anda mempercayai sepenuhnya penulis dan memahami bagaimana ia berfungsi. Anda juga boleh menjumpai alternatif sumber terbuka dan percuma yang lain di dalam skrip komuniti kami.
Arahan penulis
Penafian
Skrip jemputan sahaja
Hanya pengguna disahkan oleh penulis boleh mengakses skrip ini. Anda perlu memohon dan mendapatkan kebenaran untuk menggunakannya. Keizinan selalunya diberikan selepas pembayaran. Untuk lebih butiran, ikuti arahan penulis di bawah atau hubungi LiquidityTracker secara terus.
TradingView TIDAK menyarankan pembayaran atau penggunaan skrip kecuali anda mempercayai sepenuhnya penulis dan memahami bagaimana ia berfungsi. Anda juga boleh menjumpai alternatif sumber terbuka dan percuma yang lain di dalam skrip komuniti kami.