PROTECTED SOURCE SCRIPT
Stocker++
Stocker++ Comprehensive Documentation
Overview
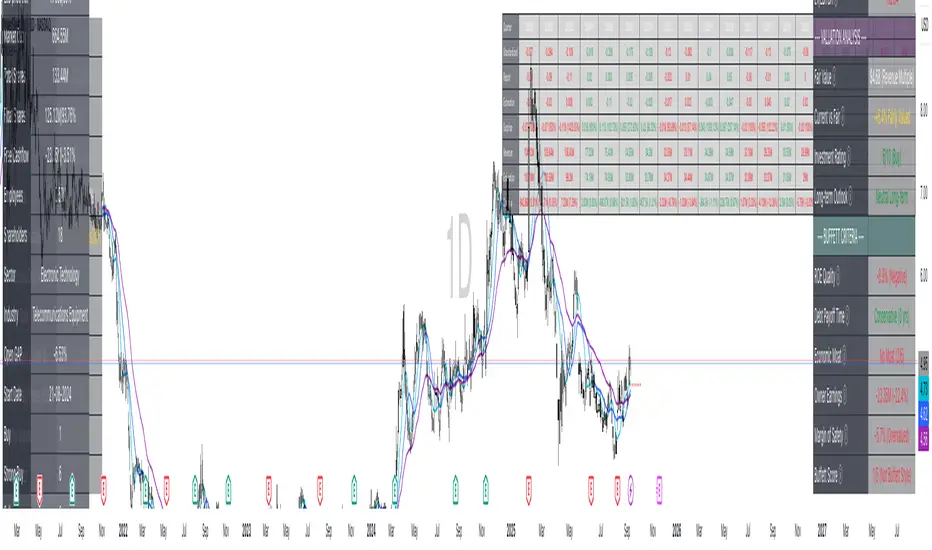
Stocker++ is an advanced stock analysis indicator that combines technical trend analysis with fundamental company data to provide comprehensive investment insights. This all-in-one tool displays multiple moving averages for trend identification and presents detailed financial information through organized data tables, helping investors make informed decisions based on both price action and company fundamentals.
Key Features
1. Customizable Moving Averages
Up to 6 configurable moving averages (MA1-MA6)
Choice between Simple Moving Average (SMA) and Exponential Moving Average (EMA)
Individual color customization for each MA
Adjustable lengths, timeframes, and visibility toggles
Default setup includes 10, 20, and 50-period MAs for short to medium-term trend analysis
2. Risk Management Table
Displays critical position sizing and risk calculations:
Account Size: Your total trading capital
Risk Money: Dollar amount and percentage at risk per trade
Stop Loss: Calculated using either ATR or Low of Day
Shares to Buy: Optimal position size based on risk parameters
Position Size: Total dollar amount and percentage of account
Max Allowed Position: Maximum position based on liquidity constraints (Daily Volume ÷ 200)
Min Required Daily Vol: Minimum liquidity needed for your position size
Liquidity Ratio: How many times over the minimum liquidity requirement
Average Daily Volume ($): 20-day average dollar volume
Average Daily Shares Volume: 20-day average share volume
Relative Volume: Current volume compared to 20-day average
Volume Buzz: Percentage increase/decrease from average volume
3. Company Info Table
Essential company metrics and market data:
Change: Daily price change in dollars
ATR: Average True Range for volatility measurement
ADR: Average Daily Range percentage
LoD price/dist: Low of Day price and distance percentage
Market Cap: Total market capitalization
Total Shares: Outstanding shares
Float Shares: Tradeable shares and percentage of total
Free Cashflow: Cash generation and percentage of market cap
Employees: Total employee count
Shareholders: Number of shareholders
Sector/Industry: Business classification
Open GAP: Gap percentage from previous day
Analyst Ratings: Buy/Strong Buy/Hold/Sell/Strong Sell recommendations with totals
4. Earnings Table
Quarterly earnings history displaying:
Quarter: Year/Month of earnings
Standardized: Standardized EPS
Report: Actual reported EPS
Estimation: Analyst consensus estimate
Surprise: Beat/miss amount and percentage
Revenue: Actual quarterly revenue
Estimation: Revenue estimates
Surprise: Revenue beat/miss with percentage
Color-coded results (green for beats, red for misses)
5. Financial Analysis Table
Comprehensive fundamental analysis across multiple sections:
Income Statement:
Revenue (Quarterly)
Gross Profit with margin percentage
Operating Income with margin
Net Income with margin
Earnings Per Share (EPS)
Balance Sheet:
Total Assets
Total Liabilities
Shareholders Equity
Cash & Equivalents
Total Debt
Debt/Equity Ratio
Valuation Metrics:
Market Cap
Enterprise Value
EV/Revenue
Price/Book Ratio
Book Value per Share
Return on Equity (ROE)
Return on Assets (ROA)
Key Multipliers:
P/E Ratio
P/S Ratio
PEG Ratio
EV/EBITDA
Valuation Analysis:
Fair Value calculation using multiple methods
Current vs Fair Value percentage
Investment Rating (0-10 scale)
Long-term Outlook assessment
Warren Buffett Criteria:
ROE Quality (>15% target)
Debt Payoff Time (<3 years ideal)
Economic Moat score (0-6)
Owner Earnings with margin
Margin of Safety (>25% target)
Overall Buffett Score (0-5)
Settings Configuration
Moving Average Settings
Enable/Disable: Toggle each MA on/off
MA Type: Choose SMA or EMA for each line
Length: Set period for each MA (default: 10, 20, 50, 100, 150, 200)
Timeframe: Set specific timeframe for each MA
Colors: Customize each MA line color
Table Settings
Each table includes:
Show/Hide Toggle: Enable or disable individual tables
Position: Choose from 6 screen positions
Text Size: Auto, Tiny, Small, Normal, Large, or Huge
Colors: Customize table background, highlight, and text colors
Risk Management Settings
Account Size: Your trading capital
Risk Per Trade (%): Percentage to risk per position
Position Multiplier: Adjustment factor for position sizing
Stop Loss Level: Choose between ADR or Low of Day
ADR/ATR Length: Periods for volatility calculations
Usage Tips
Trend Analysis: Use moving averages to identify trend direction and strength. Price above all MAs suggests uptrend.
Position Sizing: Use the Risk Management table to calculate proper position size based on your risk tolerance.
Liquidity Check: Ensure the Liquidity Ratio is >1 (preferably >2) before entering large positions.
Earnings Analysis: Review earnings history for consistency and trend. Look for companies that consistently beat estimates.
Buffett Score: A score of 4-5 indicates a potential long-term value investment following Warren Buffett's principles.
Investment Rating: Scores above 7 suggest strong investment potential, while below 4 indicates caution.
Important Notes
Designed exclusively for stock market analysis
All recommendations are for educational purposes only
Best used in conjunction with personal research and risk tolerance
Data updates in real-time during market hours
Some financial metrics may not be available for all stocks (particularly pre-revenue companies)
Overview
Stocker++ is an advanced stock analysis indicator that combines technical trend analysis with fundamental company data to provide comprehensive investment insights. This all-in-one tool displays multiple moving averages for trend identification and presents detailed financial information through organized data tables, helping investors make informed decisions based on both price action and company fundamentals.
Key Features
1. Customizable Moving Averages
Up to 6 configurable moving averages (MA1-MA6)
Choice between Simple Moving Average (SMA) and Exponential Moving Average (EMA)
Individual color customization for each MA
Adjustable lengths, timeframes, and visibility toggles
Default setup includes 10, 20, and 50-period MAs for short to medium-term trend analysis
2. Risk Management Table
Displays critical position sizing and risk calculations:
Account Size: Your total trading capital
Risk Money: Dollar amount and percentage at risk per trade
Stop Loss: Calculated using either ATR or Low of Day
Shares to Buy: Optimal position size based on risk parameters
Position Size: Total dollar amount and percentage of account
Max Allowed Position: Maximum position based on liquidity constraints (Daily Volume ÷ 200)
Min Required Daily Vol: Minimum liquidity needed for your position size
Liquidity Ratio: How many times over the minimum liquidity requirement
Average Daily Volume ($): 20-day average dollar volume
Average Daily Shares Volume: 20-day average share volume
Relative Volume: Current volume compared to 20-day average
Volume Buzz: Percentage increase/decrease from average volume
3. Company Info Table
Essential company metrics and market data:
Change: Daily price change in dollars
ATR: Average True Range for volatility measurement
ADR: Average Daily Range percentage
LoD price/dist: Low of Day price and distance percentage
Market Cap: Total market capitalization
Total Shares: Outstanding shares
Float Shares: Tradeable shares and percentage of total
Free Cashflow: Cash generation and percentage of market cap
Employees: Total employee count
Shareholders: Number of shareholders
Sector/Industry: Business classification
Open GAP: Gap percentage from previous day
Analyst Ratings: Buy/Strong Buy/Hold/Sell/Strong Sell recommendations with totals
4. Earnings Table
Quarterly earnings history displaying:
Quarter: Year/Month of earnings
Standardized: Standardized EPS
Report: Actual reported EPS
Estimation: Analyst consensus estimate
Surprise: Beat/miss amount and percentage
Revenue: Actual quarterly revenue
Estimation: Revenue estimates
Surprise: Revenue beat/miss with percentage
Color-coded results (green for beats, red for misses)
5. Financial Analysis Table
Comprehensive fundamental analysis across multiple sections:
Income Statement:
Revenue (Quarterly)
Gross Profit with margin percentage
Operating Income with margin
Net Income with margin
Earnings Per Share (EPS)
Balance Sheet:
Total Assets
Total Liabilities
Shareholders Equity
Cash & Equivalents
Total Debt
Debt/Equity Ratio
Valuation Metrics:
Market Cap
Enterprise Value
EV/Revenue
Price/Book Ratio
Book Value per Share
Return on Equity (ROE)
Return on Assets (ROA)
Key Multipliers:
P/E Ratio
P/S Ratio
PEG Ratio
EV/EBITDA
Valuation Analysis:
Fair Value calculation using multiple methods
Current vs Fair Value percentage
Investment Rating (0-10 scale)
Long-term Outlook assessment
Warren Buffett Criteria:
ROE Quality (>15% target)
Debt Payoff Time (<3 years ideal)
Economic Moat score (0-6)
Owner Earnings with margin
Margin of Safety (>25% target)
Overall Buffett Score (0-5)
Settings Configuration
Moving Average Settings
Enable/Disable: Toggle each MA on/off
MA Type: Choose SMA or EMA for each line
Length: Set period for each MA (default: 10, 20, 50, 100, 150, 200)
Timeframe: Set specific timeframe for each MA
Colors: Customize each MA line color
Table Settings
Each table includes:
Show/Hide Toggle: Enable or disable individual tables
Position: Choose from 6 screen positions
Text Size: Auto, Tiny, Small, Normal, Large, or Huge
Colors: Customize table background, highlight, and text colors
Risk Management Settings
Account Size: Your trading capital
Risk Per Trade (%): Percentage to risk per position
Position Multiplier: Adjustment factor for position sizing
Stop Loss Level: Choose between ADR or Low of Day
ADR/ATR Length: Periods for volatility calculations
Usage Tips
Trend Analysis: Use moving averages to identify trend direction and strength. Price above all MAs suggests uptrend.
Position Sizing: Use the Risk Management table to calculate proper position size based on your risk tolerance.
Liquidity Check: Ensure the Liquidity Ratio is >1 (preferably >2) before entering large positions.
Earnings Analysis: Review earnings history for consistency and trend. Look for companies that consistently beat estimates.
Buffett Score: A score of 4-5 indicates a potential long-term value investment following Warren Buffett's principles.
Investment Rating: Scores above 7 suggest strong investment potential, while below 4 indicates caution.
Important Notes
Designed exclusively for stock market analysis
All recommendations are for educational purposes only
Best used in conjunction with personal research and risk tolerance
Data updates in real-time during market hours
Some financial metrics may not be available for all stocks (particularly pre-revenue companies)
Skrip dilindungi
Skrip ini diterbitkan sebagai sumber tertutup. Akan tetapi, anda boleh menggunakannya dengan percuma dan tanpa had – ketahui lebih lanjut di sini.
Penafian
Maklumat dan penerbitan adalah tidak dimaksudkan untuk menjadi, dan tidak membentuk, nasihat untuk kewangan, pelaburan, perdagangan dan jenis-jenis lain atau cadangan yang dibekalkan atau disahkan oleh TradingView. Baca dengan lebih lanjut di Terma Penggunaan.