OPEN-SOURCE SCRIPT
Up vs Down Volume Compared to Price
Hi team,
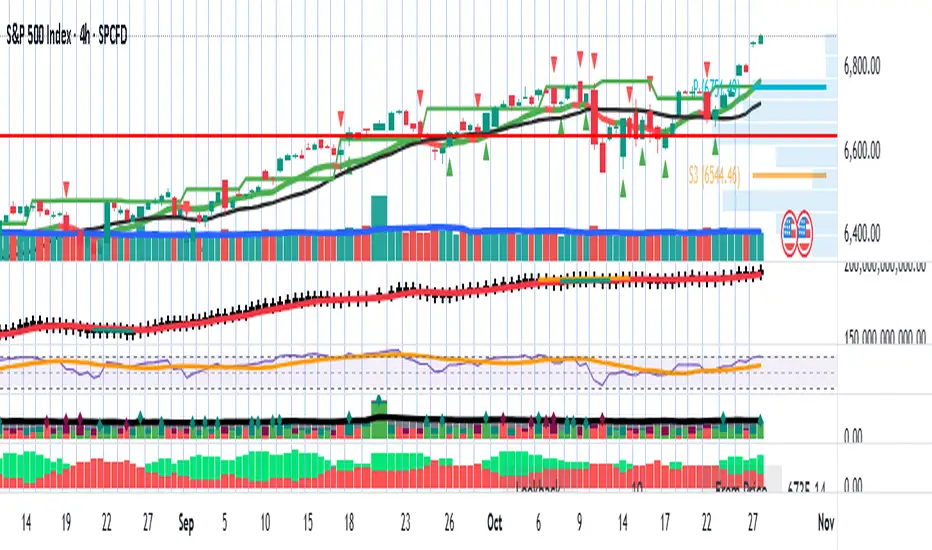
I’ve put together a simple TradingView indicator that breaks down the last N candles into up-moves and down-moves, showing how much volume supported each side. It helps you quickly see whether the market is rallying on strong participation or just drifting higher on weak volume.
The tool tracks total up-volume versus down-volume, compares their ratios, and flags when pullbacks are happening with noticeably lower volume than the prior push up — a setup that often signals a healthy continuation rather than a reversal.
It also shows key metrics like total volume, price change, and up/down ratios directly on the chart for quick assessment. You’ll instantly know if you’re looking at a light-volume pullback or a heavy-volume sell-off.
Let’s test it out across a few symbols and discuss any tweaks we’d like — maybe layering an EMA or VWAP filter for cleaner trend confirmation.
Skrip sumber terbuka
Dalam semangat TradingView sebenar, pencipta skrip ini telah menjadikannya sumber terbuka, jadi pedagang boleh menilai dan mengesahkan kefungsiannya. Terima kasih kepada penulis! Walaupuan anda boleh menggunakan secara percuma, ingat bahawa penerbitan semula kod ini tertakluk kepada Peraturan Dalaman.
Penafian
Maklumat dan penerbitan adalah tidak bertujuan, dan tidak membentuk, nasihat atau cadangan kewangan, pelaburan, dagangan atau jenis lain yang diberikan atau disahkan oleh TradingView. Baca lebih dalam Terma Penggunaan.