OPEN-SOURCE SCRIPT
VPCI MA cross [LM]
Hello guys,
I would like to introduce you a script that combines two indicators: VPCI( volume price confirmation indicator) and donchian MAs
VPCI:
Fundamentally, the VPCI reveals the proportional imbalances between price trends and volume-adjusted price
trends. An uptrend with increasing volume is a market characterized by greed supported by the fuel needed to
grow. An uptrend without volume is complacent and reveals greed deprived of the fuel needed to sustain itself.
Investors without the influx of other investors ( volume ) will eventually lose interest and the uptrend should
eventually breakdown.
A falling price trend reveals a market driven by fear. A falling price trend without volume reveals apathy, fear
without increasing energy. Unlike greed, fear is self-sustaining, and may endure for long time periods without
increasing fuel or energy. Adding energy to fear can be likened to adding fuel to a fire and is generally bearish
until the VPCI reverses. In such cases, weak-minded investor's, overcome by fear, are becoming irrationally
fearful until the selling climax reaches a state of maximum homogeneity. At this point, ownership held by weak
investor’s has been purged, producing a type of heat death capitulation. These occurrences may be visualized by
the VPCI falling below the lower standard deviation of a Bollinger Band of the VPCI, and then rising above the
lower band, and forming a 'V' bottom.
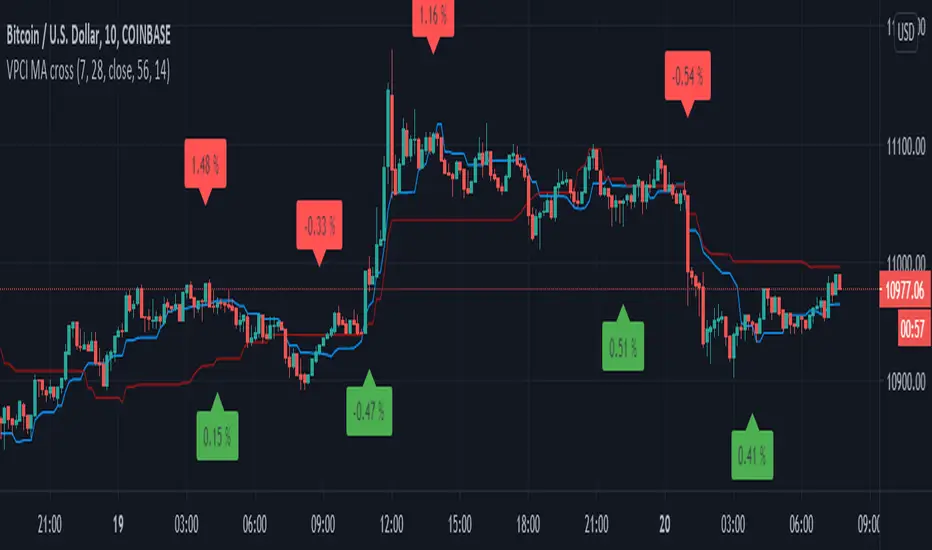
I have used MA's on top of VPCI and looking for crosses. Percatage that is shown in label is calculation of difference between previous cross and current close price. So you know if you would be flipping what % you would gain or loose, all is rounded with precission of two
DONCHIAN
I took donchain calculation from ichimoku to calculate conversion line and base line(both are giving me information about whether it's trending or not and distance from the mean)
There are various sections in setting:
VPCI - setting of MA lengths(for smaller timeframes I recommend using bigger MA length)
DONCHAIN - setting length for conversion and base line
Any suggestions are welcome
I would like to introduce you a script that combines two indicators: VPCI( volume price confirmation indicator) and donchian MAs
VPCI:
Fundamentally, the VPCI reveals the proportional imbalances between price trends and volume-adjusted price
trends. An uptrend with increasing volume is a market characterized by greed supported by the fuel needed to
grow. An uptrend without volume is complacent and reveals greed deprived of the fuel needed to sustain itself.
Investors without the influx of other investors ( volume ) will eventually lose interest and the uptrend should
eventually breakdown.
A falling price trend reveals a market driven by fear. A falling price trend without volume reveals apathy, fear
without increasing energy. Unlike greed, fear is self-sustaining, and may endure for long time periods without
increasing fuel or energy. Adding energy to fear can be likened to adding fuel to a fire and is generally bearish
until the VPCI reverses. In such cases, weak-minded investor's, overcome by fear, are becoming irrationally
fearful until the selling climax reaches a state of maximum homogeneity. At this point, ownership held by weak
investor’s has been purged, producing a type of heat death capitulation. These occurrences may be visualized by
the VPCI falling below the lower standard deviation of a Bollinger Band of the VPCI, and then rising above the
lower band, and forming a 'V' bottom.
I have used MA's on top of VPCI and looking for crosses. Percatage that is shown in label is calculation of difference between previous cross and current close price. So you know if you would be flipping what % you would gain or loose, all is rounded with precission of two
DONCHIAN
I took donchain calculation from ichimoku to calculate conversion line and base line(both are giving me information about whether it's trending or not and distance from the mean)
There are various sections in setting:
VPCI - setting of MA lengths(for smaller timeframes I recommend using bigger MA length)
DONCHAIN - setting length for conversion and base line
Any suggestions are welcome
Skrip sumber terbuka
Dalam semangat TradingView sebenar, pencipta skrip ini telah menjadikannya sumber terbuka, jadi pedagang boleh menilai dan mengesahkan kefungsiannya. Terima kasih kepada penulis! Walaupuan anda boleh menggunakan secara percuma, ingat bahawa penerbitan semula kod ini tertakluk kepada Peraturan Dalaman.
Penafian
Maklumat dan penerbitan adalah tidak bertujuan, dan tidak membentuk, nasihat atau cadangan kewangan, pelaburan, dagangan atau jenis lain yang diberikan atau disahkan oleh TradingView. Baca lebih dalam Terma Penggunaan.