OPEN-SOURCE SCRIPT
Telah dikemas kini [dharmatech] U.S. Treasury Yield Curve
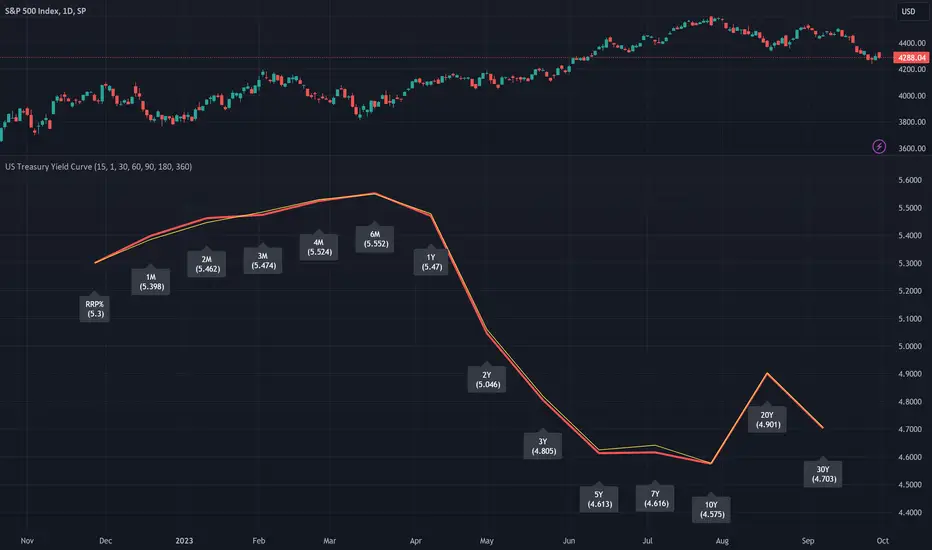
This indicator displays the U.S. Treasury Securities Yield Curve.
This is a fork of the US Treasury Yield Curve indicator by @longflat. Thank you for sharing your work!
There are already so many yield curve indicators on TradingView.
What makes this one different?
Update to version 5 of Pine Script
Add RRP%
Add 4 month
Add 20 year
Show previous day's yield curve
Options for prior yield curves
The thick red line shows the latest yield curve.
The yellow line shows the yield curve 1 bar ago.
So, if your timeframe is set to 1 day, the yellow line will show yesterday's yield curve.
Nota Keluaran
Hardcoded timeframe of securities to 1D.Without this, RRP doesn't load at lower timeframes.
Also, without this, at lower timeframes, the yield curve difference is sometimes hardly noticeable.
Skrip sumber terbuka
Dalam semangat TradingView sebenar, pencipta skrip ini telah menjadikannya sumber terbuka, jadi pedagang boleh menilai dan mengesahkan kefungsiannya. Terima kasih kepada penulis! Walaupuan anda boleh menggunakan secara percuma, ingat bahawa penerbitan semula kod ini tertakluk kepada Peraturan Dalaman.
Penafian
Maklumat dan penerbitan adalah tidak bertujuan, dan tidak membentuk, nasihat atau cadangan kewangan, pelaburan, dagangan atau jenis lain yang diberikan atau disahkan oleh TradingView. Baca lebih dalam Terma Penggunaan.