OPEN-SOURCE SCRIPT
Telah dikemas kini [blackcat] L2 Ehlers Relative Vigor Index
Level: 2
Background
John F. Ehlers introuced Relative Vigor Index in his "Cybernetic Analysis for Stocks and Futures" chapter 6 on 2004.
Function
Relative Vigor Index (RVI) uses concepts dating back over three decades and also uses modern filter and digital signal processing theory to realize those concepts as a practical and useful indicator. The RVI merges the old concepts with the new technologies. The basic idea of the RVI is that prices tend to close higher than
they open in up markets and tend to close lower than they open in down markets. The vigor of the move is thus established by where the prices reside at the end of the day. To normalize the index to the daily trading range, the change in price is divided by the maximum range of prices for the day.
The RVI is an oscillator, and we are therefore only concerned with the cycle modes of the market in its use. The sharpest rate of change for a cycle is at its midpoint. Therefore, in the ascending part of the cycle we would expect the difference between the close and open to be at a maximum. This is like a derivative in calculus, where the derivative of a sinewave produces a negative cosine wave. The derivative is therefore a waveform that leads the original sinewave by a quarter cycle. Also, from calculus, integration of a sinewave over a half-cycle period results in another sinewave delayed by a quarter cycle. Summing over a half cycle is basically the same as mathematically integrating, with the result that the waveshape of the sum is delayed by a quarter wavelength relative to the input. The net result of taking the differences and summing produces an oscillator output in phase with the cyclic component of the price. It is also possible to generate a leading function if the summation window is less than a half wavelength of the Dominant Cycle. If a cycle measurement is not available, you can sum the RVI components over a fixed default period. A nominal value of 8 is suggested because this is approximately half the period of most cycles of interest.
Key Signal
RVI ---> Relative Vigor Index fast line
Trigger ---> Relative Vigor Index slow line
Pros and Cons
100% John F. Ehlers definition translation of original work, even variable names are the same. This help readers who would like to use pine to read his book. If you had read his works, then you will be quite familiar with my code style.
Remarks
The 27th script for Blackcat1402 John F. Ehlers Week publication.
Readme
In real life, I am a prolific inventor. I have successfully applied for more than 60 international and regional patents in the past 12 years. But in the past two years or so, I have tried to transfer my creativity to the development of trading strategies. Tradingview is the ideal platform for me. I am selecting and contributing some of the hundreds of scripts to publish in Tradingview community. Welcome everyone to interact with me to discuss these interesting pine scripts.
The scripts posted are categorized into 5 levels according to my efforts or manhours put into these works.
Level 1 : interesting script snippets or distinctive improvement from classic indicators or strategy. Level 1 scripts can usually appear in more complex indicators as a function module or element.
Level 2 : composite indicator/strategy. By selecting or combining several independent or dependent functions or sub indicators in proper way, the composite script exhibits a resonance phenomenon which can filter out noise or fake trading signal to enhance trading confidence level.
Level 3 : comprehensive indicator/strategy. They are simple trading systems based on my strategies. They are commonly containing several or all of entry signal, close signal, stop loss, take profit, re-entry, risk management, and position sizing techniques. Even some interesting fundamental and mass psychological aspects are incorporated.
Level 4 : script snippets or functions that do not disclose source code. Interesting element that can reveal market laws and work as raw material for indicators and strategies. If you find Level 1~2 scripts are helpful, Level 4 is a private version that took me far more efforts to develop.
Level 5 : indicator/strategy that do not disclose source code. private version of Level 3 script with my accumulated script processing skills or a large number of custom functions. I had a private function library built in past two years. Level 5 scripts use many of them to achieve private trading strategy.
Nota Keluaran
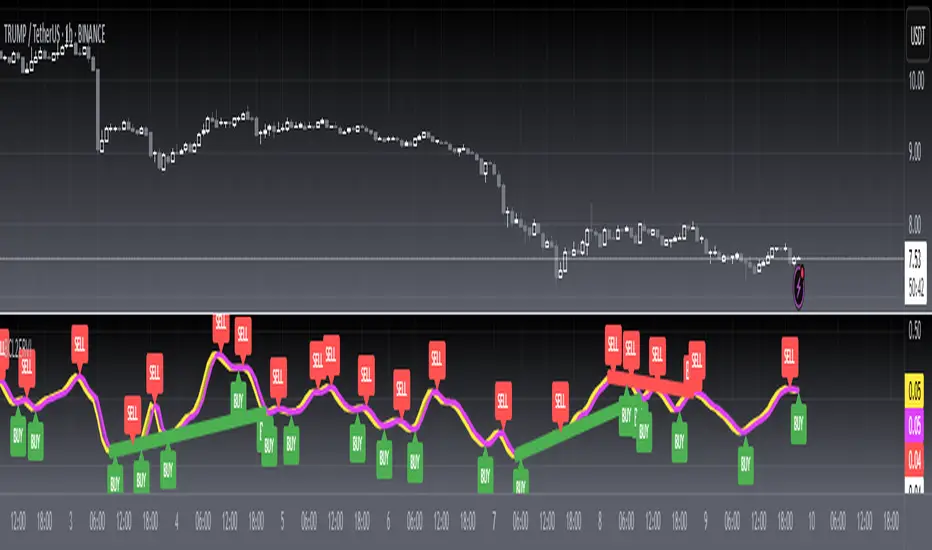
OVERVIEW The L2 Ehlers Relative Vigor Index (ERVI) is an advanced technical indicator that combines the Relative Vigor Index with pivot point analysis to identify potential trading opportunities. It provides visual signals for bullish and bearish divergences while maintaining a clean interface.FEATURES
• Calculates the Relative Vigor Index using weighted price differences
• Identifies bullish and bearish divergences through pivot points
• Offers both regular and hidden divergence detection
• Provides customizable alert conditions for each type of divergence
• Includes buy/sell signal labels at RVI crossovers
• Adjustable lookback periods for pivot detection
HOW TO USE
Add the indicator to your chart
Adjust the following inputs as needed: • Length: Period for RVI calculation • Pivot Lookback Right/Left: Range for pivot detection • Max/Min Lookback Range: Limits for divergence detection
Enable/disable bullish/bearish plots using respective toggles
Monitor for:
RVI line crossing above/below trigger line (buy/sell signals)
Bullish/Bearish divergence patterns
Hidden bullish/bearish divergences
LIMITATIONS
• Requires sufficient historical data for accurate calculations
• Divergence detection may produce false signals in trending markets
• Alert conditions are based on pattern recognition and should be used with additional confirmation
NOTES
• The indicator uses Ehlers' Relative Vigor Index methodology
• Color coding helps distinguish between bullish (green) and bearish (red) signals
• Divergence patterns are highlighted with custom shapes and labels
• Alert conditions can be customized in TradingView's alert settings
Skrip sumber terbuka
Dalam semangat TradingView sebenar, pencipta skrip ini telah menjadikannya sumber terbuka, jadi pedagang boleh menilai dan mengesahkan kefungsiannya. Terima kasih kepada penulis! Walaupuan anda boleh menggunakan secara percuma, ingat bahawa penerbitan semula kod ini tertakluk kepada Peraturan Dalaman.
Avoid losing contact!Don't miss out! The first and most important thing to do is to join my Discord chat now! Click here to start your adventure: discord.com/invite/ZTGpQJq 防止失联,请立即行动,加入本猫聊天群: discord.com/invite/ZTGpQJq
Penafian
Maklumat dan penerbitan adalah tidak bertujuan, dan tidak membentuk, nasihat atau cadangan kewangan, pelaburan, dagangan atau jenis lain yang diberikan atau disahkan oleh TradingView. Baca lebih dalam Terma Penggunaan.