DEMA Indicator
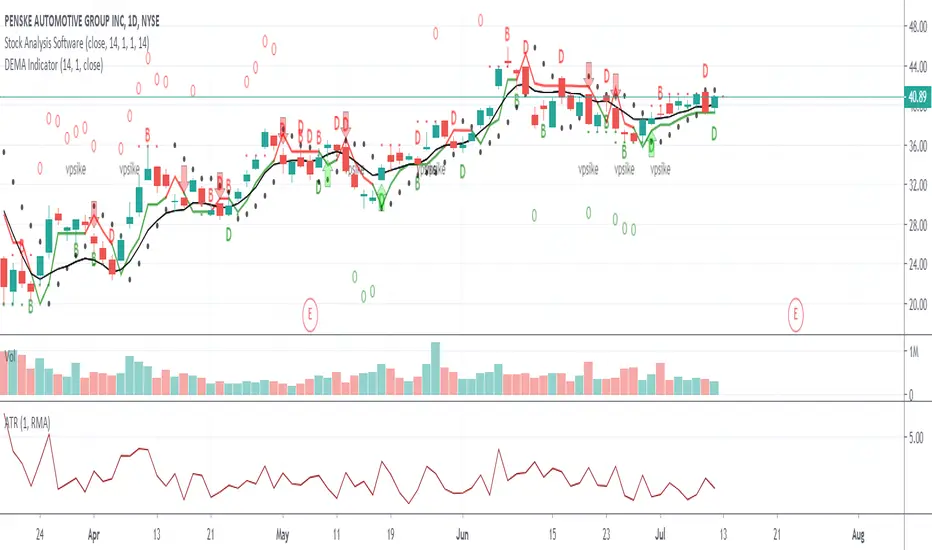
The DEMA indicator is part of the stock analysis software trading system and will highlight on the chart when the moving average and candle are touching on a certain percent ratio. When the candle is GREEN and touching the moving average in the correct ratio it will show a GREEN D below the candle. If the candle is RED and it is touching the moving average in the correct ratio it will plot a RED D above the candle.
If you look at any of these charts you will see the red and green D's. The green D's below the green candles would signal a more bullish looking setup where as a red D would signal a more bearish looking setup.
This indicator is great when added to the complete system to look for entries but also exits. This indicator has been used by myself for many years as a trading professional.
Skrip jemputan sahaja
Hanya pengguna disahkan oleh penulis boleh mengakses skrip ini. Anda perlu memohon dan mendapatkan kebenaran untuk menggunakannya. Keizinan selalunya diberikan selepas pembayaran. Untuk lebih butiran, ikuti arahan penulis di bawah atau hubungi Dancharles secara terus.
TradingView TIDAK menyarankan pembayaran atau penggunaan skrip kecuali anda mempercayai sepenuhnya penulis dan memahami bagaimana ia berfungsi. Anda juga boleh menjumpai alternatif sumber terbuka dan percuma yang lain di dalam skrip komuniti kami.
Arahan penulis
Penafian
Skrip jemputan sahaja
Hanya pengguna disahkan oleh penulis boleh mengakses skrip ini. Anda perlu memohon dan mendapatkan kebenaran untuk menggunakannya. Keizinan selalunya diberikan selepas pembayaran. Untuk lebih butiran, ikuti arahan penulis di bawah atau hubungi Dancharles secara terus.
TradingView TIDAK menyarankan pembayaran atau penggunaan skrip kecuali anda mempercayai sepenuhnya penulis dan memahami bagaimana ia berfungsi. Anda juga boleh menjumpai alternatif sumber terbuka dan percuma yang lain di dalam skrip komuniti kami.