PROTECTED SOURCE SCRIPT
Telah dikemas kini Support/Resistance Levels
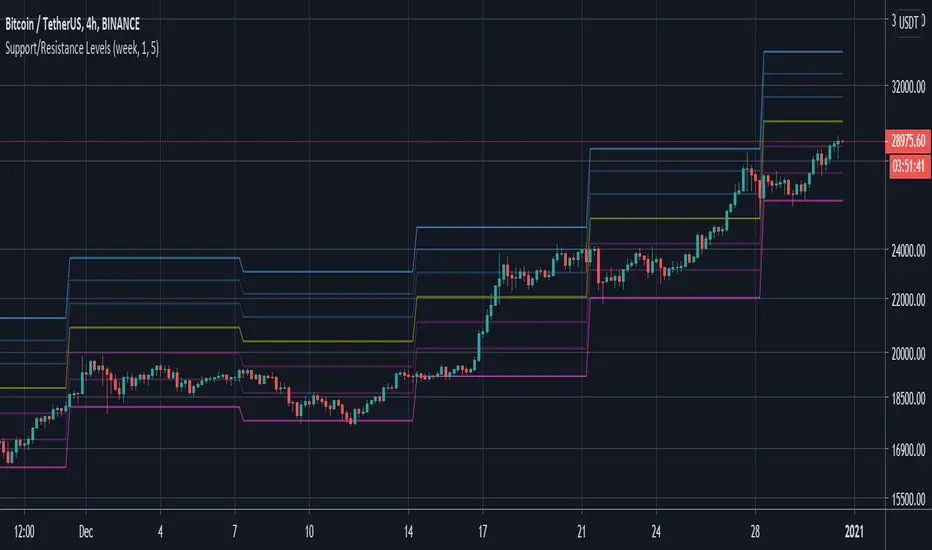
This script will show lines of support/resistance in each period you set (default is 1week). It shows 6 levels with the difference you can set too (default is 5%). The reason why I set default as 5% because as I notice the market will get bounced when it reach 5% up/down and hold that level for some time before it start moving up/down again. Hope this script will help you decide whether it's time to buy/sell when it reached the levels. Thank you.
Nota Keluaran
Make it cleaner with lesser lines and better coloringsNota Keluaran
- Transparent level for default has changed- Mainly for updating the chart screenshot with a clean chart
Skrip dilindungi
Skrip ini diterbitkan sebagai sumber tertutup. Akan tetapi, anda boleh menggunakannya secara bebas dan tanpa apa-apa had – ketahui lebih di sini.
Penafian
Maklumat dan penerbitan adalah tidak bertujuan, dan tidak membentuk, nasihat atau cadangan kewangan, pelaburan, dagangan atau jenis lain yang diberikan atau disahkan oleh TradingView. Baca lebih dalam Terma Penggunaan.