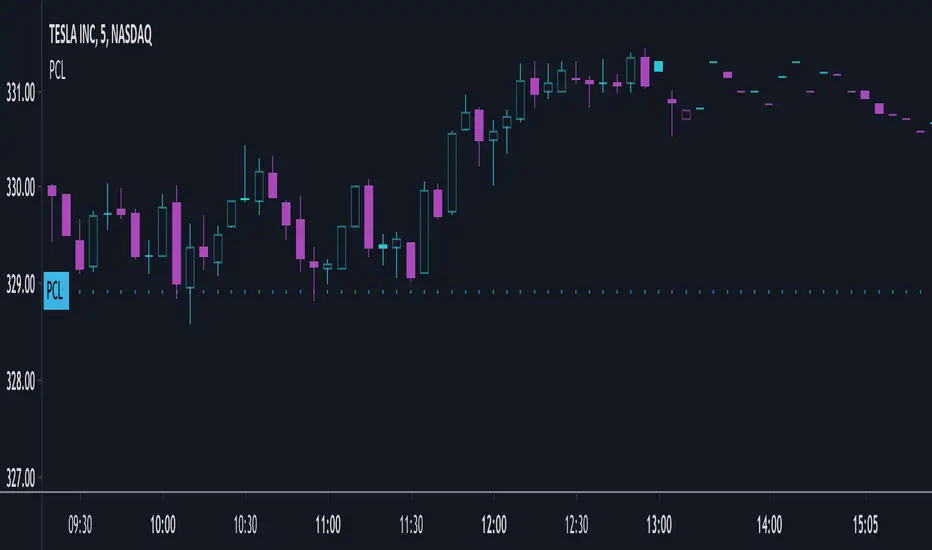
(PCL) Previous CloseI have recently been reading How to Day Trade for a Living by Andrew Aziz and one of the important support and resistance levels he talks about is the Previous Day Close Price.
I did not find an indicator that would simply plot this so I wrote a short simple pine script to plot the indicator.
Please feel free to edit or suggest improvements.
[i]price
USOIL to MCX Crude INR - by AnanthThis Indicator convert and display the MCX Crude oil price in INR by calculating the USOIL Multiplied by USDINR plus Slippage Buffer value. The buffer can be set by the user as Input Value.

[RS]Plot in 3DEXPERIMENTAL:
plotting price,time,volume + additional price shift from moving average.

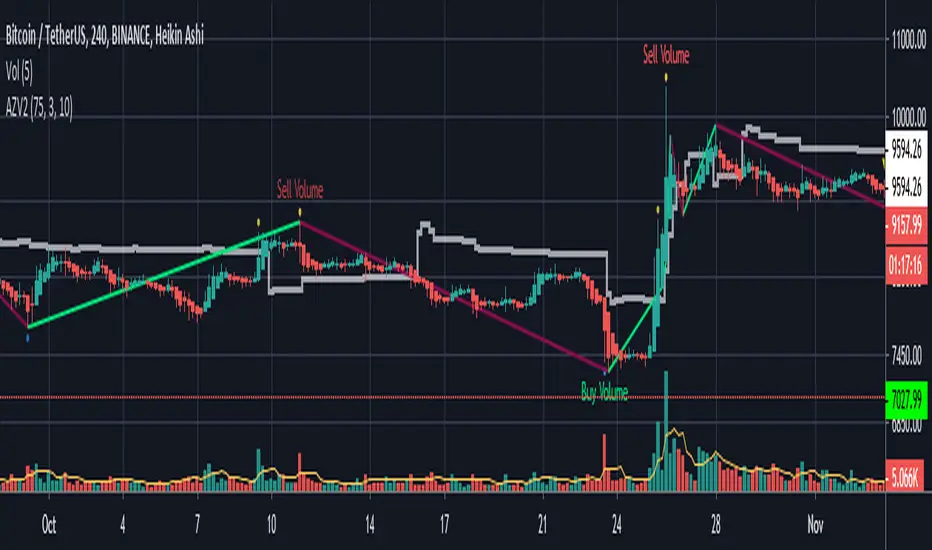
AZV Indicator
AVZ
Market is changing by 4 Factors which are (PVTTI - Price - Volume - Trades - Time
This indicator is a hybrid, with a combination of leading indicators and lagging trending indicators combined into one,and it's using mostly the 3 factors_ PVT which will help you getting good trades .
Volume :-
Leading indicators such as Volume Spikes , Average Volume Spikes (VolMA) ,and a special Spike calculation using RSI as a function with volume as a source .
Price:-
SemiLead indicators such as Aroon Indicator , RSI .
Time and Price Combination :-
Trend Recognition using Harmonic and Zigzag implementation from 'RicardoSantos' .
.
www.investopedia.com
Volatility Recognition : Using a special calculation to get the average called ( ZScore ) with Vwap implementation .
en.wikipedia.org
www.investopedia.com
How to use ?
This indicator is using number of bars of the last wave whatever if it's UP wave or Down wave .
Type number of bars on the specified area of the wave ( Bars Of Wave )
How many NO. Bar s to get accurate levels ?
1- If you are searching for a Support level , you have to count the number of bars of last UP wave from its low to it's high .
2- If you are searching for a Resistant level , you have to count the number of bars of last Down wave from its high to its low .
Buying Signal and Selling Signal ?
The indicator tries to identify levels that Buying Volume enter in the same way for Selling Volume .
Pumpenomics Price-action Levels (OHL M)Simple price-action levels in regards to the OHL and M levels.
Levels available:
Open (Orange)
High (Green)
Low (Red)
Middle [ /2] (Aqua)
Timeframes available:
1H, 4H, Daily, Weekly, Monthly, Quarterly, Yearly
Enjoy!
-
Inspired by Long Term Levels (4h, D, W, M, Q, & Y) by scarf

PriceScalperThis is a simple script that will visually show where buy and sell points occur based upon configurable price action. I wrote this purposefully to evaluate stablecoins and other narrow or fixed ranged markets where algorythms don't generally do well.
Putple triangles, pointing up, are buy signals.
Purple triangles, pointing down are sell signals
Alert conditions of BUY ASSET and SELL ASSET are provided for convience.

R100 Volatility Combo Bands v1 (*v*)The Volatility Combo Bands are made from 4 separate volatility bands- two Bollinger Bands (10 and 20 period) and two Price Headley Acceleration Bands (10 and 20 period). The Volatility Combo Bands plot the innermost upper and lower points from these bands and then plots a mid-line. By default, only the standard 20 period Bollinger Bands and Combo Bands with mid-line are displayed, but can be configured however you want.
Try it out- see squeezes earlier, ride the bands earlier in trending markets, trade pullbacks to the Combo Bands and mid-line, trade the range of the band or use them to help identify potential support and resistance levels. Hopefully they can add another dimension to identifying volatility contraction patterns or whatever you currently use these things for!
I hope you get some value out of it. Only conditions of use are that if you improve it, let me know and if you publish something that uses it, don't hide the code! Enjoy!
Code for the Price Headley Acceleration Bands pinched and modified from LazyBear - thankyou.

Support and Resistance lines by PeterOAs all seasoned traders know, there's no better trading tactics than Price Action. Price Action understood not as some fancy candlestick formations, but as horizontal lines called Support and Resistance, generated by the market in the past - where the price reacted and reversed, showing which levels were strongly defended by traders around the world.
Price very often reverses again and again from these lines and once it finally breaks through them, very often returns for a retest before continuing its journey, very juicy for the trader. Support becomes Resistance and Resistance becomes Support - surely you have heard those rules before.
Support and Resistance lines are a map to the market. They are best entry spots out there. You might want to add more tools and techniques to your trading analysis, but truth is, moves will always start on some Support or Resistance line. Very often to the tick. People not seeing these lines trade blindfolded.
Difficulty is when it comes to removing those lines. You cannot hold them forever, as the chart would get completely blurred. So this script not only automaticaly draws lines, but also deletes those which become irrelevant. It also shows lines created by 4 tiers of pivot points, by default: 2 bars, 10 bars, 60 bars and 240 bars. So on one-minute chart it would present even 4h Support and Resistance levels, perfect for finding entries even for scalpers. All configurable.
I mostly trade Forex, but S/R rules are applicable to all markets out there.
This is invite-only script, PM me for access.

Metcalfes Law - Bitcoin Fair PriceMetcalfe's Law has been successfully used to value a variety of network effect technologies and businesses, including Facebook and Tencent.
Applying Metcalfe's Law to Bitcoin, using "Daily Active Addresses" (DAA) as the "n" value, yields interesting results.
Historically, Bitcoin has tracked the Metcalfe Law Fair Price reasonably well. A number of studies have been performed over recent years which validate this and have used various derivations of Metcalfe’s Law. Note: this indicator sticks to the original Metcalf’s Law.
Prior to 2018, every time Bitcoin was above the Metcalfe’s Law fair price (calculated using a default “A” of 0.5 here), a bubble had formed, and price quickly reverted back down to the mean.
Nonetheless, since February 2018, Metcalfe's Law Fair Price has remained below the actual Bitcoin price, suggesting Bitcoin is currently overvalued.
There may be a few reasons for this:
1. Possibility A: Bitcoin may still be extremely overvalued. Since the December 2017 peak, Bitcoin has only reverted to the Metcalfe’s Law Fair Price briefly during the December 2018 bottom. If this case is true, there could be further to fall unless DAA numbers pick up to fill the gap.
2. Possibility B: The introduction of side-chains, private transactions and the Lightning Network may have fundamentally altered the effectiveness of using DAA to value Bitcoin. As more daily transactions are completed off-chain, or on large platforms/exchanges which use fewer addresses, the relative number and growth of DAA may be misrepresented and artificially low. In this case, DAA as it is reported today is no longer useful in assessing the fair value of Bitcoin with Metcalfe’s Law and this Indicator is effectively useless.
3. Possibility C: Neither of the above are true. We are just in an anomalous period in which price and Metcalfe’s Law Fair Price have deviated from the mean for an extended period (and will meet again in the future, potentially at a higher price).
4. Possibility D: Metcalfe’s Law doesn’t really work for Bitcoin.
I am inclined to believe Possibilities “C” and “D” are unlikely. Given the way Bitcoin infrastructure is being developed and used in 2019, Possibility “B” seems the most likely, as this case is supported by the fact that a number of other metrics indicate that Bitcoin is currently on the lower side of “fair value” (including Dynamic Range NVT Signal).
Regardless, Possibility “A” remains a strong candidate. Only time will tell. It will be interesting to check back on this indicator in 12-24 months time. Hopefully this indicator has been proven redundant by then.

Waves in Price (Volume Waves)Waves in Price (Volume Waves)
TheDowVolumeBigot>0 (Bullish) =Lime color
Very High=Dark Green color
High=Green color
TheDowVolumeBigot<0 (Bearish) =Orange color
Low=Red color
Very Low=Dark Red color
Barcolor


Crypto Break-even FeeWhen I started trading cryptocurrency, I lost money because I didn't take the fees enough into account. Therefore I created my own indicator to quicqly see the break-even selling price of the selling price if I want a predifined profit level.
2 lines are added to the graph. These lines move together with the current price.
- One line indicating the break-even selling price (depending on your maker/taker strategy). For beginners I suggest taking the taker strategy (mostly 0.25%)
- Another line indicating the selling price in order to make a predifined profit %
There are 2 parameters you can set:
- Desired profit (%)
- Maker/Taker Fee (%)
Always happy with a little appreciation ;-) Bitcoin wallet: 18522cAc7YDwwXTvtckXKb1kP33upVDRFR

Forecast Oscillator & Point of ForceThis is a scaled version of the Forecast Oscillator, paired with a Point of Force Indicator, my modification of an indicator, whose original name and developer happened to be missing on my notes, so my regards to the author).
Point of force is a spot from where price action will dynamically evolve in the same direction or soon reverse and pursue that reversed path. It may be an indication of a turning point or entry point to consider going long/short and should be use together with a background oscillator showing a prevailing local trend.

Previous OHLC LevelsQuick dirty code for personal use. Plots previous OHLC levels based on a selected time-frame on the chart.
Not bad if you want to see different time-frame levels.
Fill function can serve to highlight the daily range (high-low or open-close) on non-standard charts
Uses base code from JayRogers

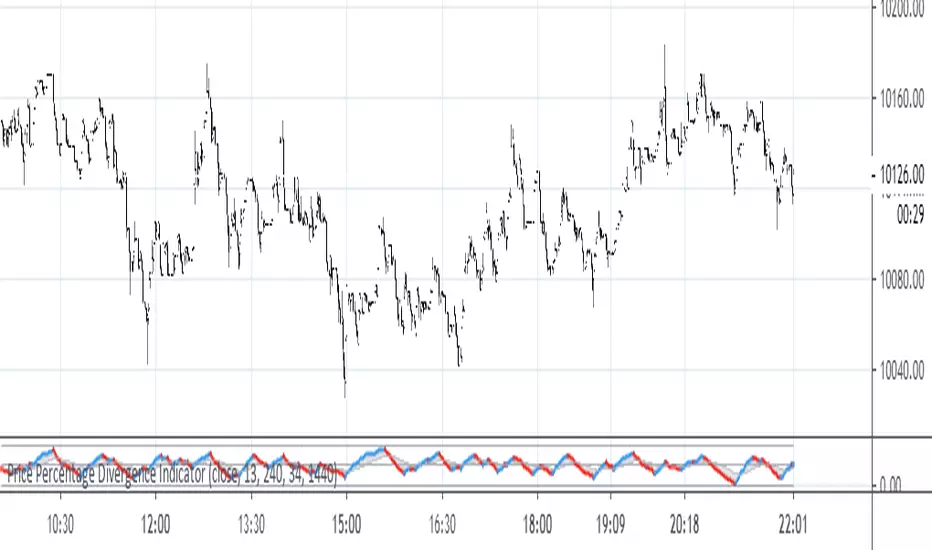
Price Percentage Divergence IndicatorThis is a price percentage divergence ( PPO ) indicator. It may as well be called a turning points indicator.)
Current Price Label by Westy_A simple Indicator to display the current price of the asset above the current bar. It shows a green label if the close is equal or greater than the open, red otherwise.
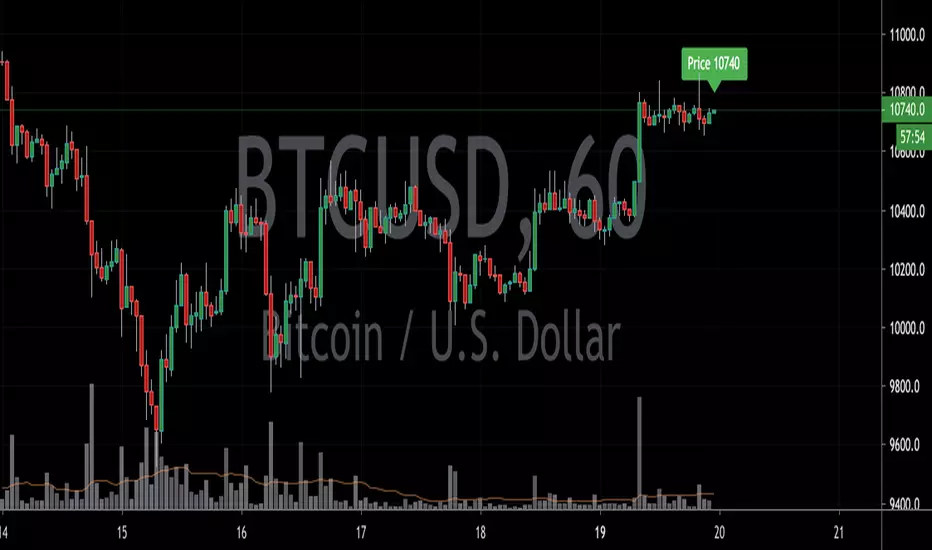
Current Price Bar LabelA simple Indicator to display the current price of the asset above the current bar. It shows a green label if the close is equal or greater than the open, red otherwise.

DH: True-Price DOTS for Heikin AshiTrue-Price DOTS for Heikin Ashi (open/close/current)
USE:
Must Set Tradingview Candle Type to Heikin Ashi.
Works on all Timeframes and symbols.
BENEFITS:
Helps keep you aware of the actual price action as you trade and historically by adding subtle DOTS and step-lines over your Heikin Ashi candles. With this indicator, you can benefit from the price averaging and smoothing effects of Heikin Ashi while benefiting from the accuracy of traditional candles and true active price levels. Helps maximize your buy and sell entries and exits.
HOW IT WORKS:
Adds true-price DOTS (showing current-price & close)
Adds STEP-LINE (showing true open) price level to Heikin Ashi candles.
DOTS will move & update on active candle with current price movement (as candle forms) . This is beneficial for accurate entry and exits during candle development period.
Option (on/off) to add current True-Price LINE (blue line) in input settings (recommended) .
NOTE:
You may need to right-click candles and arrange "visual order" so that DOTS are on top layer of chart. Otherwise some DOTS might hide behind candles.
ENJOY!
Dan Hollings
Master Crypto Grid Trader
Host of the "High Leverage Lounge"
Please Explore My Other Indicators, Scripts, Grids and Educational Ideas.
@DanHollings on Tradingview

PriceDivergence (ps4)This script implements price divergence module using signals from several factors like:
RSI, RSI Stochastic, MACD, Volume MA, Accumulation/Distribution, Fisher Transform and CCI

CryptoEarnings Alligator EMAIt is very useful indicator to predict the market trend very fast. It works in all time frame but it is more useful in short time frame like 3 Min, 5 Min, 15 Min for intraday traders

Multi Horizontal Lines 540Draws horizontal lines depends on condition of regular price, if 10000 then increment is 540, otherwise increment by 54

Opening Range Breakout - ORBThe opening range is simply the high and low of a given period after the market opens. This period is generally the first 30 minutes or the first hour of trading.
During this period, you want to identify the high and low of the day. In addition, you will also want to account for the pre-market highs and lows, as these levels will often act like a magnet on price action after the bell rings.
Since the opening bell is associated with big trading volumes and volatility, this time of the session provides many trading opportunities. In this manner, traders use the opening range to set entry points on the chart and to forecast the price action for the day.

.BADAXBT Cardano Price Index - for BitMEX - Gyro.BADAXBT script as seen on the BitMEX built-in chart.
This is not created by, authorized by or in any type of affiliation with BitMEX whatsoever.
This is not financial advice. Use at your own risk.
Tips are appreciated if you find this useful:
3BMEXty68scwEPfGGb4zkS23JdBCi3vtkh
See my other scripts for .BXBT and .BETH!
Thanks
