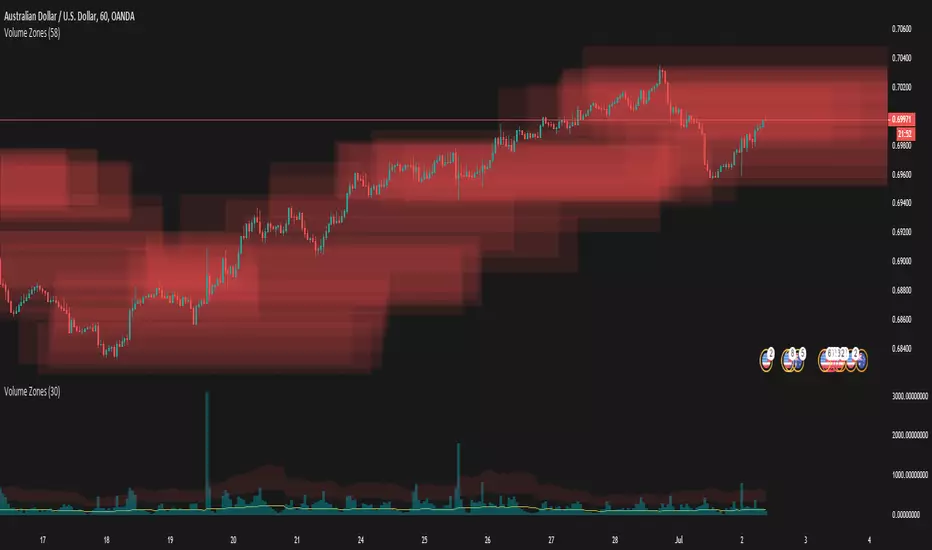
Volume ZonesThis a script that shows where price is trapped in the market based on the volume traded
The plots uses pixels. To correctly see the zones, adjust your zoom and set your level density appropriately
[i]price
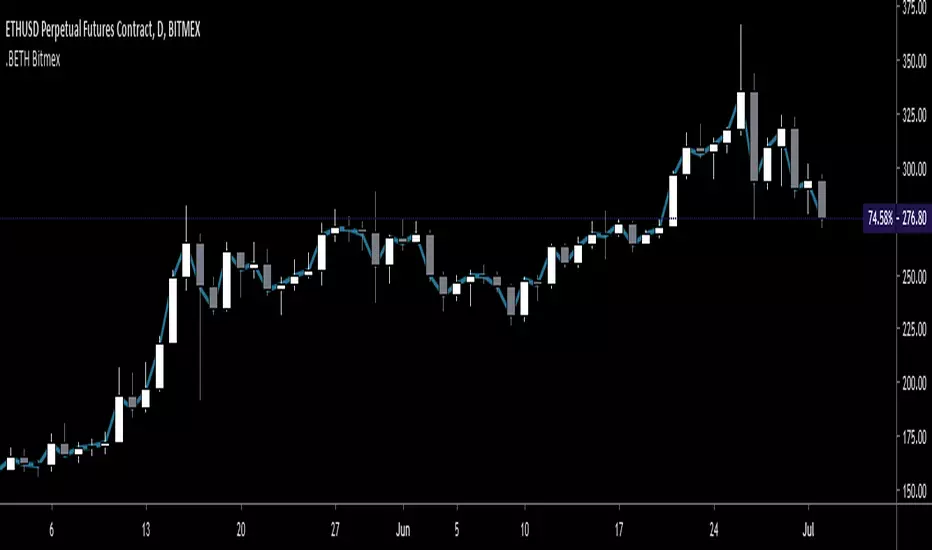
.BETH Ethereum Price Index - for BitMEX - Gyro.BETH script as seen on the BitMEX built-in chart.
This is not created by, authorized by or in any type of affiliation with BitMEX whatsoever.
This is not financial advice. Use at your own risk.
Tips are appreciated if you find this useful:
3BMEXty68scwEPfGGb4zkS23JdBCi3vtkh
See my other scripts for .BXBT!
Thanks
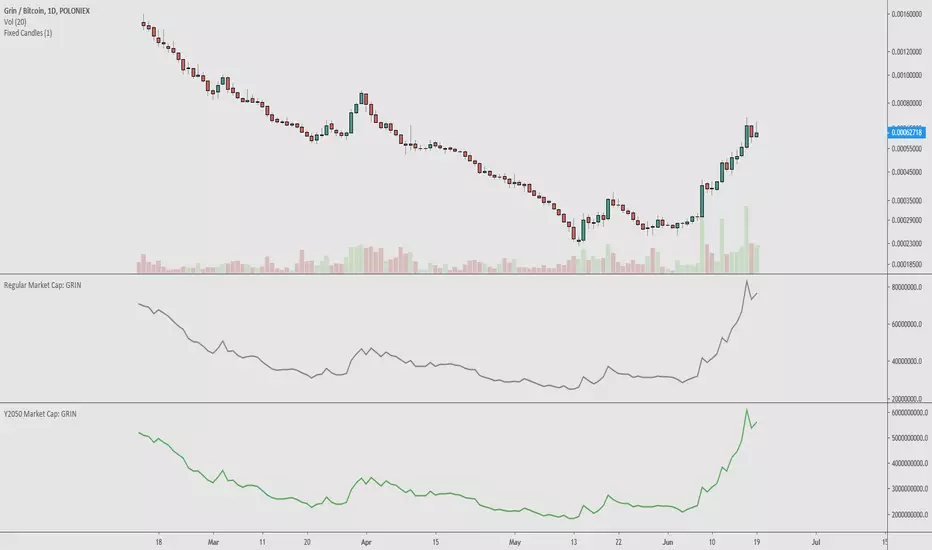
Y2050 Market Cap: GRINMethodology:
Composite of Bittrex and Poloniex to smoothen out the skewed values from lack of liquidity.
To be concise, the main advantage that a Y2050 market cap has over a 'regular' market cap is that it takes into account:
Inflation
What supply should be in the future
What the market cap could be in world of tomorrow
I'm having difficulty publishing the script so bear with me if the professional quality of the description is lacking. As always, I hope you are able to make use of this indicator and find new ways to create a consistent system to test out.
NB

Price Spread Momentum‴ | Price Spread Momentum HistogramPrice Spread Momentum‴ is a Price Spread oscillator that allows you to have a better understanding and interpretation of its behavior once you are able to see it through an histrogram.
It has extreme zones such as overspreaded and underspreaded, but these zones start, respectively, from above 100% and from under -100%, with a mid line at 0%.
What is the best is that you can use it with any kind of graphic that it will always considere the real open, close, high and low trading values.
To have access to this indicator, please contact me at: contato @ moneywise . com . br
Believe me, this indicator will make your life much easier!

🔗 Blockchain Fundamentals - NVU Ratio by Cryptorhythms🔗 Blockchain - NVU (Network Value to User) Ratio by Cryptorhythms
Introduction
Please note this is not an indicator that gives you buy and sell signals, its for bitcoin blockchain based fundamental analysis and valuation metrics.
Description
Blockchains have network effects.
The classic example of network effects is Facebook: every person who gets on Facebook makes the network a little more valuable for every other person on Facebook.
As the number of users in a network grows, the more valuable the network becomes. That’s why the most powerful companies in the world today are network companies: Facebook, Apple, Google. The old-school “blue chip” companies don’t have the benefits of network effects. (When a new customer buys your toothpaste, it doesn’t make toothpaste more valuable for everyone else.)
Blockchain assets (like bitcoin) are essentially networks. The more people who use a blockchain asset (like bitcoin), the more valuable that blockchain becomes. One way that analysts value network companies (like Facebook and Twitter) is by looking at Network Value per User. We take their market cap, then divide by their number of Monthly Active Users.
Of the top social media networks, the Value Per User generally ranges from $25 to $250. These values have fluctuated over time, but they give us some guard rails. Of the blockchains we can track, the Network Value per User is typically $1,000 and $5,000 per user. This makes sense, as we would expect blockchain NVU to be higher than social media NVU, since blockchain users are much more valuable—they’re not just mindless ad-consuming machines, like on Facebook.
The caveat is that Value Per User depends on knowing Monthly Active Users, which is not available for all blockchain assets. Blockchains that have this level of transparency will have better valuation metrics, which means they will become more trusted, and thus more highly valued.


NinaThis is for education purpose.
Nina provides opportunity to detect various peculiarities and patterns in price dynamics which are invisible to the naked eye.
It can be simultaneously used with xSuperTrend indicator. When both gives same signal, opportunity may be taken.

IO_Volatility Quality Zero LineThis is the Volatility Quality Zero Line Indicator. This indicator measures volatility strength.


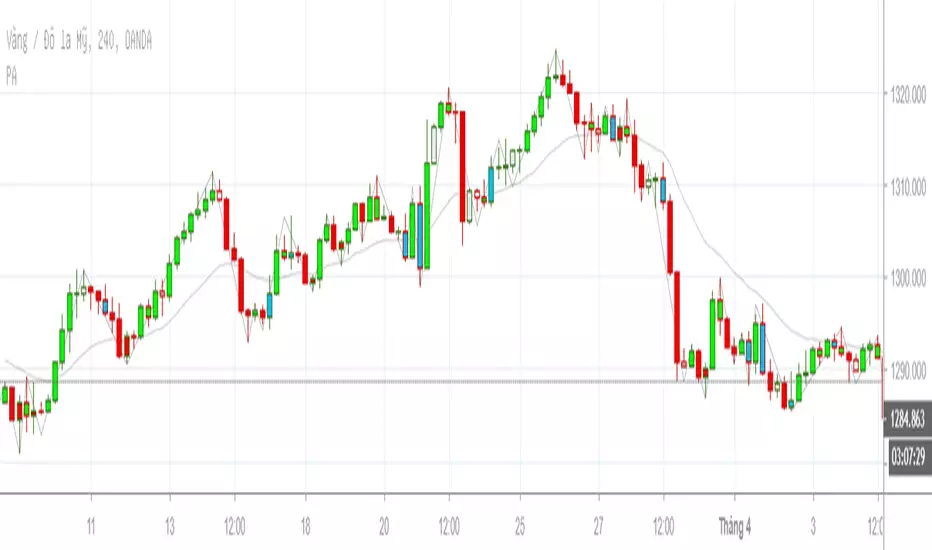
PA_Vu_TienPA + Congestion Zone + Barcolor Momentum: InsideBar, OutsideBar, UpsideBar, DownSideBar, BreakOut, BreakDown detector!
Buy and Sell PressureThis indicator is an interpolation of the demand index by James Sibbet. Thomas Aspray, an experienced trader, suggests using DI in three formats, one of those was to plot the buying pressure (BP) and selling pressure (SP) as separate lines; which is what this indicator was designed to do. The green line represents the buying pressure and red line represents the selling pressure. Advantages:
Divergences between BP or SP and price. A divergence between the BP or SP and prices suggests an approaching change in the price trend.
Crossovers can be interpreted as bullish/bearish
Known issues: illiquid crypto forex pairs or stocks with a very low price (i.e. 0.0000056) will cause the BP and SP to not work correctly, this can be mitigated by changing the quote currency, choosing an exchange with more volume, or changing the time-frame to a longer value.
The Buy and Sell Pressure indicator is available for purchase at www.cryptoalphaindicators.com

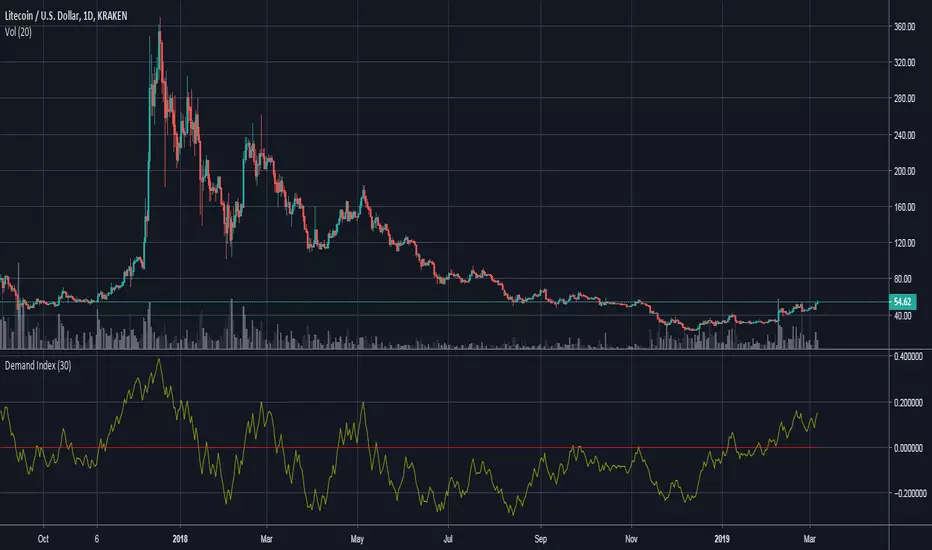
Demand IndexThis is an interpretation of James Sibbet's demand index (DI). The indicator does an excellent job of displaying:
Divergences between DI and price. A divergence between the DI and prices suggests an approaching change in the price trend.
Trendline analysis of DI showing levels of support/resistance, can help determine changes in trend.
As a leading indicator DI trendlines are often broken ahead of price trendlines.
Zero-line crossings can confirm previous signals as a lagging indicator.
The Demand Index indicator is available for purchase at www.cryptoalphaindicators.com
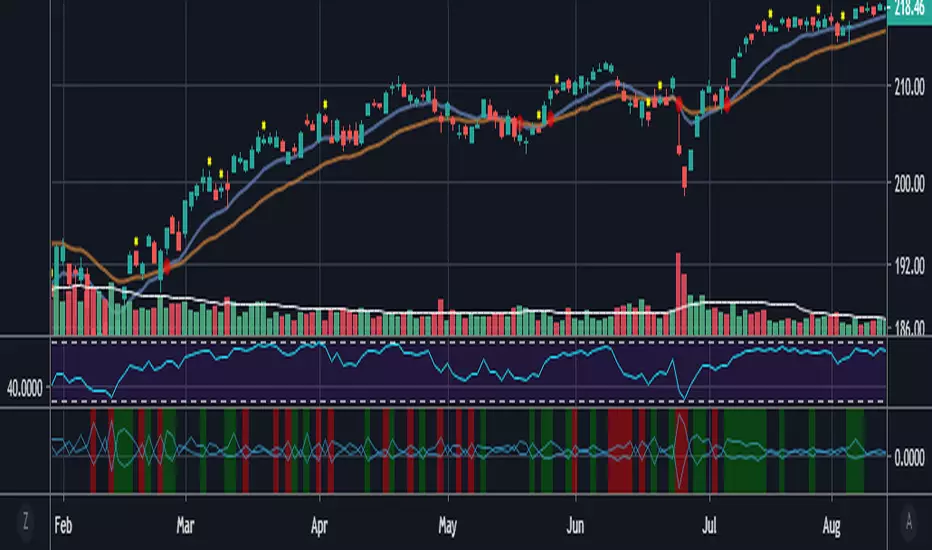
Trend Validation | www.cryptoalphaindicators.comThis indicator is designed to run in the background and provide a bird's eye view of what the prevailing trend is currently (positive/negative).
The navy blue background color indicates a positive trend underway and conversely the red background color indicates a negative trend has been detected.
Formulated with Ehler's Force Index and the Exponential Moving average.
The areas absent of color indicate that no satisfiable correlation was found between price (ema) and the price-to-volume indicator Ehler's Force Index (EFI).
The Trend Validation indicator is available for purchase at www.cryptoalphaindicators.com


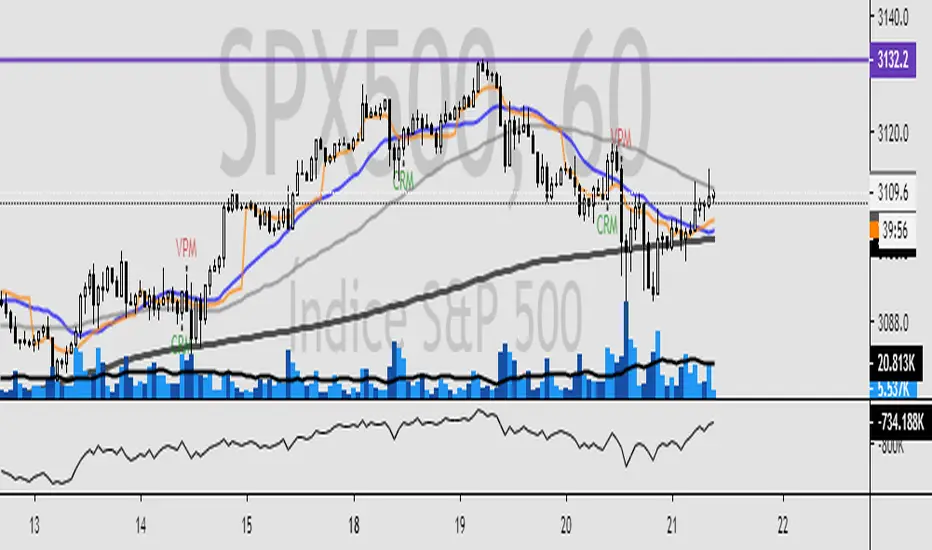
Trading Trend IndicatorEsse indicador plota na tela do ativo avaliado, pontos de compra e venda baseado em regras de tendência e confirmação por volume. Caso o ativo entre em tendência, o script plota na tela os dizeres "CPM" = Comprar na perda da máxima, ou seja comprar assim que o preço perder a máxima no próximo candle, e "VPM" = Vender na perda da mínima, assim que o preço perder a mínima no próximo candle. O indicador também avalia o volume, se o volume for 3x superior a média de 21 períodos, plota-se na tela "Vol. 3x" e se a barra de volume for 3x maior que a barra anterior, plota-se "3x" sobre o gráfico de volume.
Caso tenham interesse, solicitem o teste gratuito de 7 dias.
Description in english
This indicator plots on the screen of the evaluated asset, points of purchase and sale based on trend rules and confirmation by volume. If the asset is in trend, the script will display the words "CPM" = Buy at the loss of the maximum, ie to buy as soon as the price loses the maximum in the next candle, and "VPM" = Sell at the minimum loss, so that the price to lose the minimum in the next candle. The indicator also evaluates the volume, if the volume is 3x higher than the average of 21 periods, it is plotted in the "Vol 3x" screen and if the volume bar is 3x larger than the previous bar, it is plotted "3x" on the volume chart.
If you are interested, request a free 7-day trial.
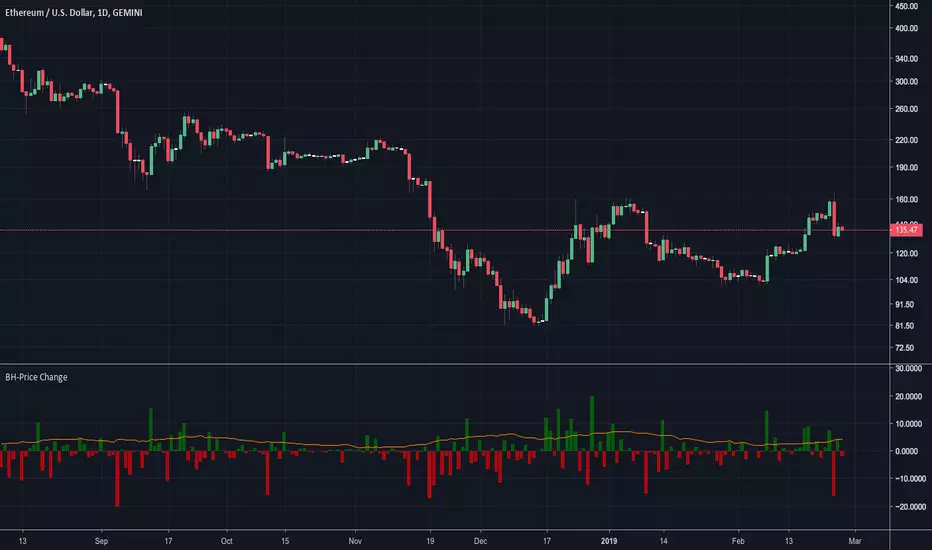
BossHouse - Price ChangeBossHouse - Price Change
What it is:
In the stock market, a price change is the difference in trading prices from one period to the next or the difference between the daily opening and closing prices of a share of stock.
Here you have a timeline with a bar price change. In seconds you can see if the selected market has good and high price changes or not.
The values are in percentage and you have a limiter in the settings, so you can show only bar/values above a value. Ex. 2.4%.
Why it Matters:
Price changes are a core component of financial analysis, and predicting price changes can be as, if not more, important than an actual price change.
It is important to remember, however, that percent-based price changes are useful only in the context of the number of dollars involved.
A 75% change in the price of a company X, for example, may only involve a few dollars while a 75% change in the price of company Y may involve thousands of dollars.
Settings:
Show the SMA 21 line
Minimum Limit - Set the minimum value to show a bar
Calculation:
For example, let's say Company XYZ shares opened at $25 this morning and closed at $24.
The price change is -$1, or -$1/$25 = -4%.
Any help and suggestions will be appreciated.
Marcos Issler @ Isslerman
Dynamic Price ChannelsThis indicator plots dynamic price channels based on the security highest close and lowest open.
The default is to display 8 core channels (with the option to plot the sub channel lines, off by default).
It’s simple really—this just divides the price action into equal channels. I’ve found this pattern helpful across all markets.
It’s dynamic because if a new high close or a new low close is created the all channels will adjust.
The key levels are 75% (blue), 50% (aqua), 25% (blue).
In between those key levels is a level separator.
The high close and the low open are both red.
These can all be customized in the settings.
What you’ll typically see at these channel boundaries are price slow downs, reversals, support and resistance.
Turning on sub-channels will provide further channel plots. On these sub-channels you’ll also see the same type of price action activity as mentioned above.
I’ve developed a trading system where this indicator helps identify key pivot areas. Combined with a few other indicators and key EMAs this trade system provides high probability trades around these key channel areas.


High/Low Breaker v2Specify Candles back to determine if high/low has been broken. Can choose to either calculate with source of high/low or close.
