EMA21/SMA21 + ATR Bands SuiteThe EMA/SMA + ATR Bands Suite is a powerful technical overlay built around one of the most universally respected zones in trading: the 21-period moving average. By combining both the EMA21 and SMA21 into a unified framework, this tool defines the short-term mean with greater clarity and reliability, offering a more complete picture of trend structure, directional bias, and price equilibrium. These two moving averages serve as the central anchor — and from them, the script dynamically calculates adaptive ATR bands that expand and contract with market volatility. Whether you trade breakouts, pullbacks, or reversion setups, the 21 midline combined with ATR extensions offers a powerful lens for real-time market interpretation — adaptable to any timeframe or asset.
🔍 What's Inside?
✅ EMA21 + SMA21 Full Plots and Reduced-History Segments using arrays:
Enable full plots or segmented lines for the most recent candles only with automatic color coding. The reduced-history plots are perfect for reducing clutter on your chart.
✅ ATR Bands (2.5x & 5x):
Adaptive ATR-based volatility envelopes plotted around the midline (EMA21 + SMA21) to indicate:
🔸Potential reversion zones.
🔸Trend continuation breakouts.
🔸Dynamic support/resistance levels.
🔸 Expanding or contracting volatility states
🔸 Trend-aware color changes — yellow when both bands are rising, purple when falling, and gray when direction is mixed
✅ Dual MA Fills (EMA21/SMA21):
Visually track when short-term momentum shifts using a fill between EMA21 and SMA21
✅ EMA5 & EMA200 Labels:
Display anchored labels with rounded values + % difference from price, helping you track short-term + macro trends in real-time.
✅ Intelligent Bar Coloring
Bars are automatically colored based on both price direction and position relative to the EMA/SMA. This provides instant visual feedback on trend strength and structural alignment — no need to second-guess the market tone.
✅ Dynamic Close Line Tools:
Track recent price action with flexible close-following lines
✅ RSI Overlay on Candles:
Optional RSI + RSI SMA displayed above the current bar, with automatic color logic.
🎯 Use Cases
➖Trend Traders can identify when price is stacked bullishly across moving averages and breaking above ATR zones.
➖Mean Reversion Traders can fade extremes at 2.5x or 5x ATR zones.
➖Scalpers get immediate trend insight from colored bar overlays and close-following lines.
➖Swing Traders can combine multi-timeframe EMAs with volatility thresholds for higher confluence.
📌 Final Note:
As powerful as this script can be, no single indicator should be used in isolation. For best results, combine it with price action analysis, higher-timeframe context, and complementary tools like trendlines, moving averages, or support/resistance levels. Use it as part of a well-rounded trading approach to confirm setups — not to define them alone.
21sma

Tribute to David PaulI made this indicator as a tribute to the late David Paul .
He mentioned quite a lot about 89 periods moving average (especially on 4h), also the 21 and 55.
I put up some entries when three ma are crossed by price in the same direction, bull/bear backgrounds and a color code for candles because who doesn't love the feeling of a lasting trend.
To be more specific :
The indicator plots sma21, sma55, sma89 and AMA = (sma21+sma55+sma89)/3
When the closing price crosses the highest of the 3 sma, it is considered a bullish confirmation.
At this moment two lines appear, one on the bottom of the candle that crossed, one on the crossing point.
The lowest line can be used as the stop loss value of a long.
The highest line can be used as an entry point for a long.
When the closing price crosses the lowest of the 3 sma, it is considered a bearish confirmation.
At this moment two lines appear, one on the top of the candle that crossed, one on the crossing point.
The highest line can be used as the stop loss value of a short.
The lowest line can be used as an entry point for shorts.
When the closing price is above AMA, it is considered a bullish confirmation.
At this time a blue background appears at the crossing point.
The highest line can be used as the stop loss value for a long.
The starting point of the background can be used as the entry point for a long.
When the closing price is below AMA, it is considered a bearish confirmation.
At this time a red background appears at the crossing point.
The highest line can be used as the stop loss value for a short.
The starting point of the background can be used as the entry point for a short.
When the price is above 3 sma the candles turn blue. Signifying an upward trend.
When the price is below 3 sma the candles turn red. Signifying a bearish trend.
When the price is neither simultaneously above nor below the 3 sma, the candles are gray and the background linked to AMA becomes less vivid. Meaning a loss of vitality of the current trend or an absence of a clear trend.
Ideally, you should take a position towards "Real Long/Short Entry", set your stop loss towards "Ideal Long/Short Entry", and close the trade either when the background ends (riskier but more potential), or when the candles become gray (more conservative but noisier).
In the inputs, you can modify the display rules (explained in the tooltips), by default everything is displayed.

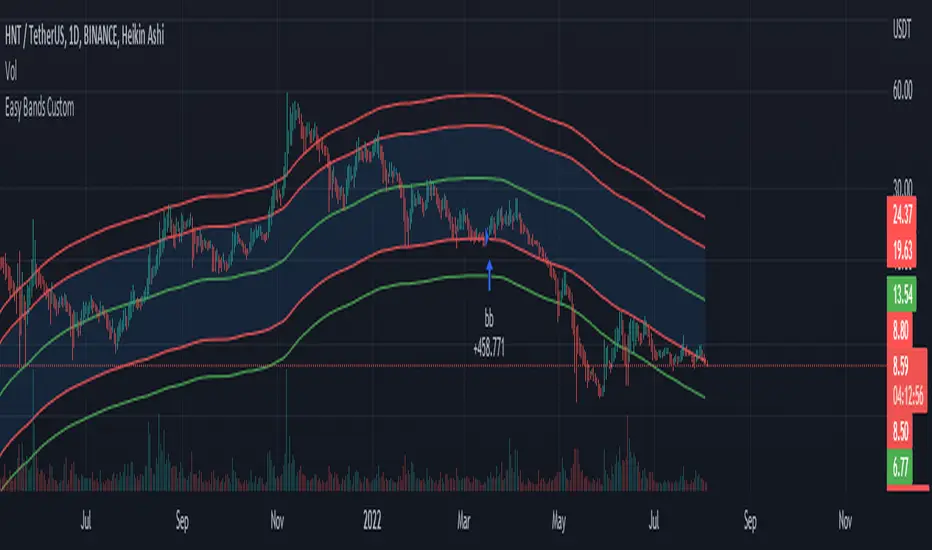
Easy Bands Custom IndicatorBased on 21 Week SMA
--- // Buy when the market is oversold - Sell when the Market is overbought // --
If you don't know what that means don't use this indicator. Good luck out there!