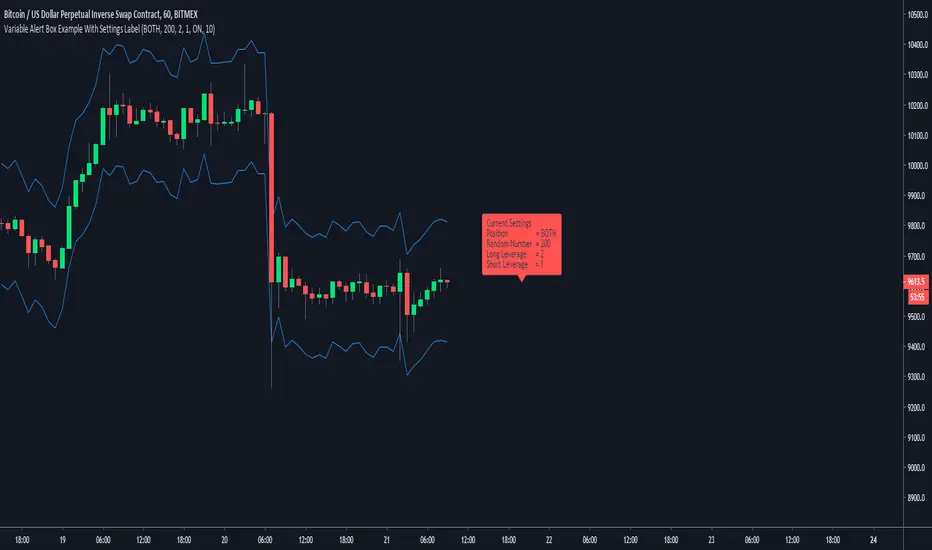
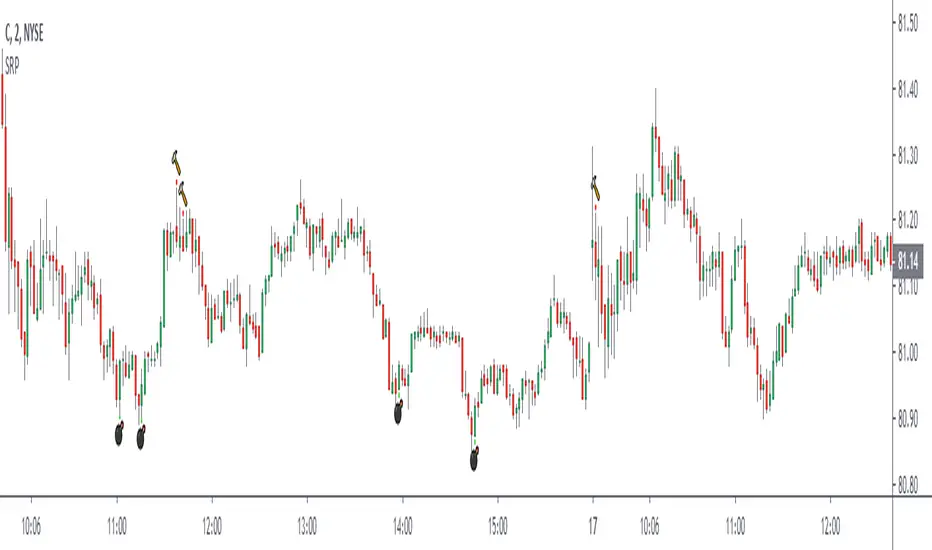
Variable Alert Box Examplejust publishing to share to novice pine coders like myself
any feedback on layout/structure/shortcuts will always be appreciated, not that this is a long script with much that can go wrong
short little what ever to show variable alert message
needs to draw the number from a plotted number like line 18 and 19, and cant be gettin the numbers from line 14 and 16
Alerts
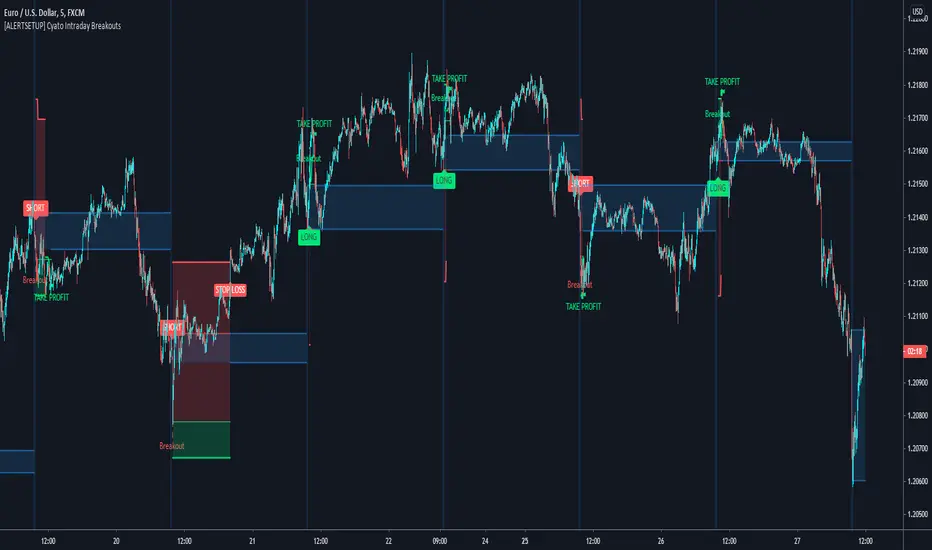
Cyatophilum Intraday Breakouts [ALERT SETUP]Private indicator.
Here is the alert version of the Triple Screen Strategy
Recap of the strategy:
The goal of this indicator is to be able to automate and backtest the strategy, all while staying on a single chart and without repainting.
Features:
Market Tide MACD configuration
Market Wave choice between 3 oscillator: Elder Force Index, Stochastic and William Percent Range
Automated Long and Short entries alerts
Integrated Trailing Stop Loss system fully configurable with automated exit alerts
Integrated Trailing Take profit system fully configurable with automated exit alerts
Indicator samples
Backtest version:
Alerts
Entry Long: Triggers on green long labels.
Take Profit Long: Triggers on the "TAKE PROFIT" green flag if the long target is reached.
Stop Loss Long: Triggers on the "STOP LOSS" or "TSSL" label if the stop loss line has been crossed.
Exit Long: Triggers on either of Take Profit Long or Stop loss long.
Entry Short: Triggers on red short labels.
Take Profit Short: Triggers on the "TAKE PROFIT" green flag if the short target is reached.
Stop Loss Short: Triggers on the "STOP LOSS" or "TSSL" label if the stop loss line has been crossed.
Exit Short: Triggers on either of Take Profit Short or Stop Loss Short.
To get access to this indicator use the link below
Thanks for reading!
NiLUX Trend Scalper TSSL (Alerts)Trend Following Scalping Bot
Great results on pretty much any pair and timeframe
Features:
Dynamic Trend Detection
Long / Short Scalp Alerts
Take Profit (Trailing Stop) & Stop Loss Alerts
TP/SL Plots for Profitview included
This is Donationware 🍺
Leave me a tip, you decide the amount, then send me a DM to get access.
The link to my tip jar is below in the signature


Best Volatility CalculatorHello traders,
This indicator shows the average volatility, of last N Periods, for the selected time frames.
You can select up to 2 timeframes with this version
Volatility is defined as the close of current candle - close of the previous N candle
Presented as Currency, Pip, percentage labels in a panel below.
Will calculate in real-time only for the current instrument on the chart.
The indicator is coded to not be repainting
Example
In the indicator screenshot, I used a lookback period of 1.
That compares the current candle close versus the previous one for the daily and weekly timeframe
Showing how the results are calculated for the weekly calculations
Enjoy :)
Best regards
Dave

QQE signalsConverted the QQE oscillator to in-chart long and short signals with built in alerts. This is multi-timeframe and quite robust.

Best Ichimoku ScreenerHello traders
Continuing deeper and stronger with the screeners' educational series one more time
I - Concept
This screener detects whether the price goes above, below or stays in between the Ichimoku cloud
II - How did I set the screener
The visual signals are as follow:
- square: Above or Below
Then the colors are:
- green when above the cloud
- red when below the cloud
- orange when in the cloud
Best regards,
Dave

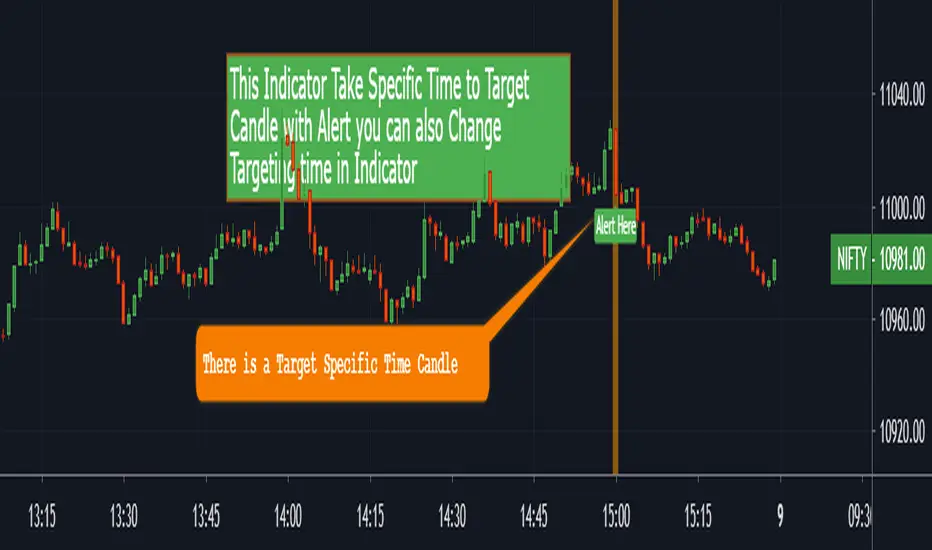
Alert with Specific Candle [MV}This Indicator Takes Specific Time to Target Candle With Alert
You Can Also Change Targeting Time in Indicator
You Can Also Add Alert
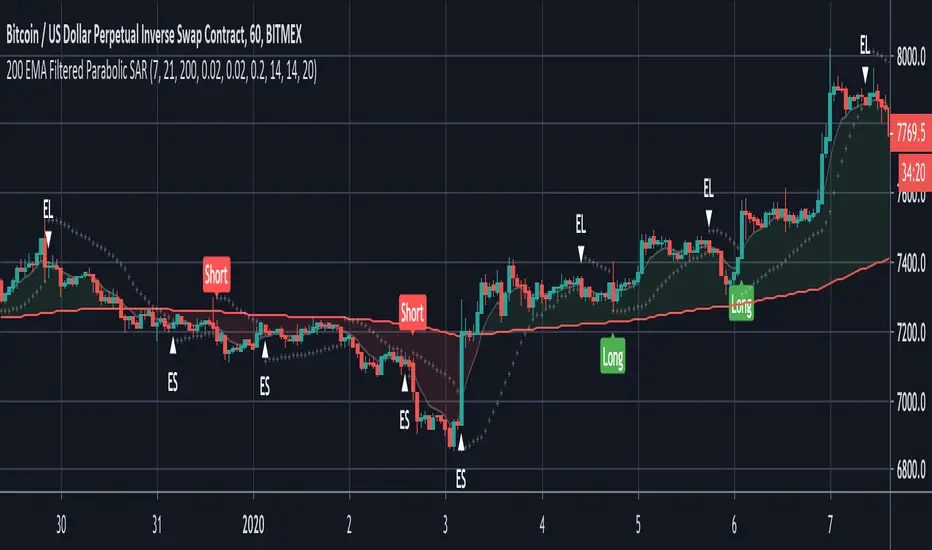
200 EMA Filtered Parabolic SARThis script uses Parabolic SAR with the 200 EMA to determine long and short trends. Only long signals are given when the price is above the 200MA and shorts when it is below. Signals are further filtered using ADX to reduce noise.
Suitable for trading bots where open positions in the same type are set to be ignored.
Alerts are built in.
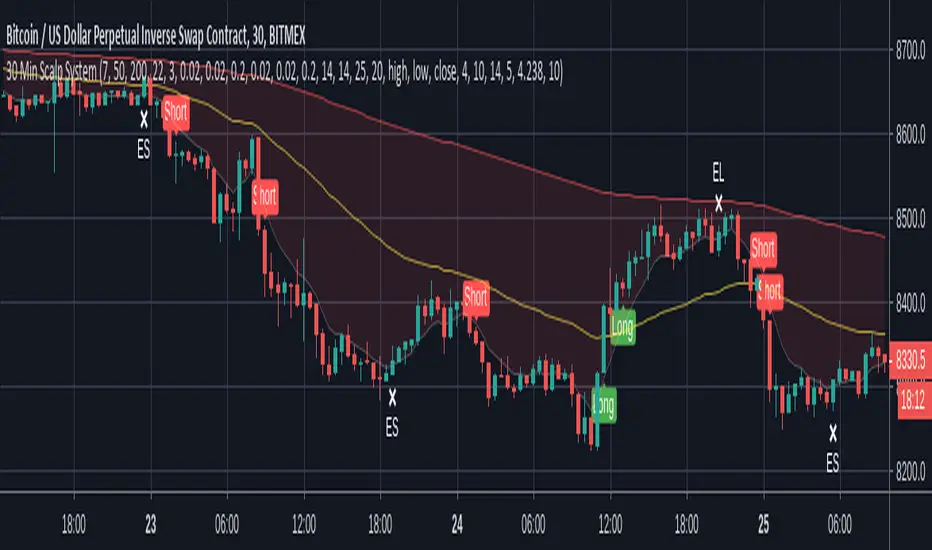
30 Min Scalp SystemA scalping script for the 30 min chart that is designed and tuned to be used with trading bots such as ProfitView or Autoview. I personally trade with this on Bitmex.
This trading system is built upon 4 established trading indicators that compliment each other. All signals are filtered in a number of ways to avoid chop and only trigger when a strong trend or crossover is identified.
Alerts are included for longs, shorts and exits in both directions.
Recommended setup:
- Trade with leverage and take 75%-80% out at 0.5% profit, leaving the rest to run
- Initial stop-loss of 1%, initiating a trailing stop of 0.75% when TP is hit
- Ensure bots are set to ignore open orders in the same direction
I use this in conjunction with ProfitView where I run three custom scripts to manage my position entries, monitor profit levels, dynamically move my stop and then exit positions where appropriate.
Note: Exit signals are show here even when trades aren't open because it's only possible to hide these when using a strategy script. This is coded as an indicator so that alerts can be sent to your chosen bot.
Disclaimer: The signals aren't perfect but no script is. The above cannot be considered financial advice and I take no responsibility from any losses incurred. A test account is recommended to verify the win rate before trading on a live platform.
BEST Dollar Cost AverageHello traders
This is an upgraded version of my Dollar Cost Average (Data Window) script
1 - What is Dollar-Cost Averaging ( DCA )?
Dollar-Cost Averaging is a strategy that allows an investor to buy the same dollar amount of investment at regular intervals. The purchases occur regardless of the asset's price.
I hope you're hungry because that one is a biggie and gave me a few headaches. Happy that it's getting out of my way finally and I can offer it
🔸 This indicator will analyze for the defined date range, how a dollar-cost average ( DCA ) method would have performed (green panel) versus investing all the hard earnt money at the beginning (orange panel)
=> green versus orange
2- What's on the menu today?
My indicator works with all asset classes and with the daily/weekly/monthly inputs.
⚠️⚠️⚠️ However, results are only visible on the DAILY timeframe chart
As always, let's review quickly the different fields so that you'll understand how to use it (and I won't get spammed with questions in DM ^^)
🔸 Use current resolution: if checked will use the resolution of the chart
🔸 The timeframe used for DCA: different timeframe to be used if Use current resolution is unchecked
🔸 Amount invested in your local currency: The amount in Fiat money that will be invested at each period selected above
🔸 Starting Date
🔸 Ending Date
🔹 The script screenshot shows a DCA with 100 USD invested daily from 01.01.2017 to 01.28.2020
3- Bonus (DATA WINDOW)
🔸 Please check this screenshot to understand what you're supposed to see: Data window
And a quick video that I did months ago explaining how we can use this data window effectively
4 - Specifications used
I got the idea from this website dcabtc.com and the result shown by this website and my indicator are very interesting in general and for your own trading
The formula used for the DCA calculation is the one from the Investopedia website.
Best regards and best of luck
Dave

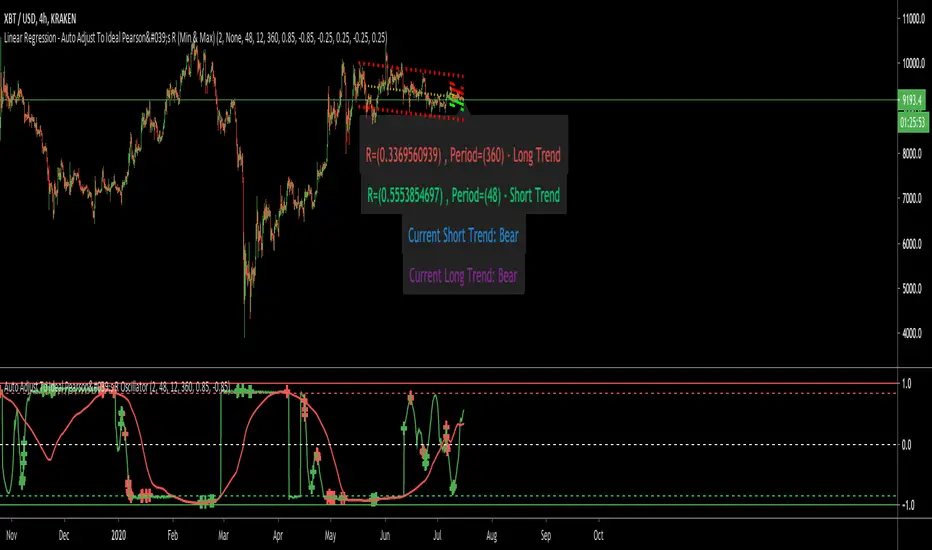
Linear Regression - Auto Adjust To Ideal Pearson's R (Min & Max)This is meant as a partner to my linear regression strategy script. This one however is just the indicator only so you can overlay the technique over other strategies.
To use this script you need to understand what Pearson's R is; which is how correlated a set of data is to a line within a given deviation (+ or -).
If the Pearson's R is negative (-) then the trend is going upwards. If the value is positive (+) then the trend is going downwards.
There is a lot of debate as to what the ideal negative and positive values are for the Pearson's R, so you can change these in the settings. What the script will do is attempt to automatically find (and draw the trend lines) based on a given minimum period and a maximum period (both set in the settings) that match the ideal Pearson's R settings selected.
Ideally the data is MOST correlated the closest it is to -1 or 1. This means the pattern is very reliable.
This script was designed and works very well with the bar replay mode. You may need a more professional version of TradingView to use this correctly. This mode allows you to see the script in action as it mutates and changes according to the new data being introduced.
I've pre-set the Pearson's R (+) and (-) ranges to what I think is ideal.
CryptoSignalScanner - Stochastic Trend IndicatorDESCRIPTION:
This script has been designed to provide the ideal buy and sell moment on the lower time frames.
• This scripts is based on the Stochastic RSI Indicator.
• When we are in an uptrend the background becomes green.
• When we are in a downtrend the background becomes red.
• It is also possibility to set the overbought and oversold range.
HOW TO USE:
• When the blue line (stochastic K) has crossed above the red line (stochastic D) in the oversold area then this is the ideal moment to get into a trade.
• When the blue line (stochastic K) has crossed below the red line (stochastic D) in the overbought area then this is the ideal moment to get out of a trade.
• Use this together with the CryptoSignalScanner - Advanced BUY/SELL indicator to get a stronger confirmation.
• Use the Fibonacci tool together with the Eliot Waves to help you to find the ideal buy or sell moment.
HOW TO GET ACCESS TO THE SCRIPT:
• Use the link below to subscribe to our indicators.
REMARKS:
• This advice is NOT financial advice.
• We do not provide personal investment advice and we are not a qualified licensed investment advisor.
• All information found here, including any ideas, opinions, views, predictions, forecasts, commentaries, suggestions, or stock picks, expressed or implied herein, are for informational, entertainment or educational purposes only and should not be construed as personal investment advice.
• We will not and cannot be held liable for any actions you take as a result of anything you read here.
• We only provide this information to help you make a better decision.
• While the information provided is believed to be accurate, it may include errors or inaccuracies.
Good Luck,
The CryptoSignalScanner Team

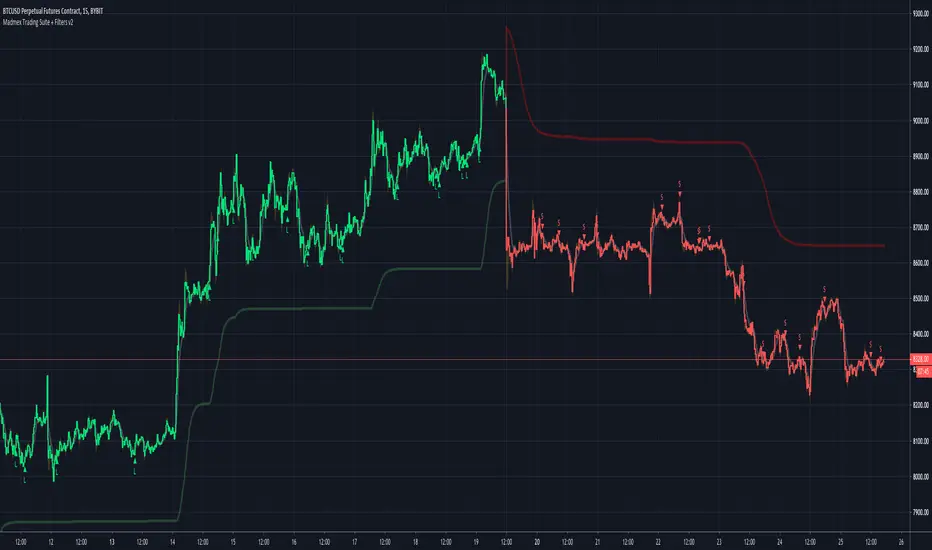
Madmex Trading Suite + FiltersA goodie for my trading groups and friends. A suite of different MAs with Filters with multiple Long/Short Alerts, works as well for pyramiding.
Using fixed TP/SL is advised. I might add TP/SL Alerts later on...
Good luck!
Feedback is appreciated!
Simple Reversal PointThis indicator finds possible points of reversion, you can use it to stack positions and get a good average price for when the price changes direction, it is the trader responsibility to manage the position and make a profit.
-Added alerts
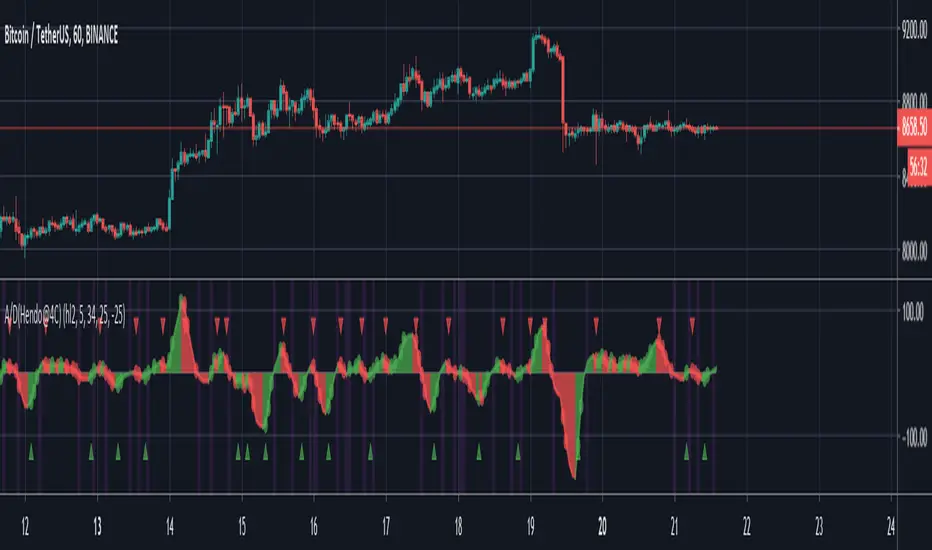
Acceleration/Deceleration with alerts (Hendo@4C)My variation of the Acceleration/Deceleration by Bill Williams. I found the existing variations of this indicator on TradingView severely lacking in terms of options. Credits go to a close friend who recommended writing this.
NOTE: The setting called: "Invert acceleration dots", can make gauging tops and bottoms "earlier" easier. Due to the nature of this indicator and the fact that you can set alerts on deceleration.
//Overview of settings//
“Plot tops and bottoms” default: True
An option to enable plotting shapes when a top or bottom is printed. I use a non conventional way to detect tops and bottoms. This secures false signals. Alerts can be added to this.
“Fill background” default: True
Fills the background between the A/D and the 0 line.
“Source for A/D” default: (high+low)/2
This is the source for calculation of the indicator. Bill Williams himself describes using the “HL2” and this is what the default value is. Potentially once could experiment with “HLC3” (high+low+close)/3. Since this is also a popular way of using this indicator.
“Length of F-SMA” default: 5
The length of the fast simple moving average that the indicator uses. Again: The default is 5 but one could experiment with higher/lower values to change the reaction time of the indicator.
“Length of S-SMA” default: 34
The lenght of the slow simple moving average that the indicator uses. The default by Bill Williams here is 34. One could experiment with higher values to reduce noise.
“Activate less noise mode” default: False
Uses a proprietary way of averaging values in price. This creates an entirely new indicator in itself. Can be very useful for trading the lower timeframes. It is however advised to understand that enabling this settings will not make the indicator the “standard A/D // AC” anymore.
“Plot alert levels” default: False
This setting allows you to plot extra levels at certain values (just like the RSI for example). Keep in mind however that you need to manually adjust the values to fit the instrument you’re trading. Of course you can set alerts to these levels. Be careful enabling this: Since it might pull the chart out of proper scaling.
“Value of +Line plot” default: 25”
Sets the level of the first “alert level” described earlier. I picked 25 as an example for Bitcoin. Be careful setting these levels: Since it might pull the chart out of proper scaling.
“Value of -Line plot” default: -25”
Sets the level of the second “alert level” described earlier. I picked -25 as an example for Bitcoin. Be careful setting these levels: Since it might pull the chart out of proper scaling.
“Fill background between lines” default: False
Enabling this will fill the background between the previously discussed +Line plot and the -Line plot. Again: Much like RSI.
“Color background if 0 is crossed” default: True
Colors the background of the indicator everytime the 0 line is crossed. Of course alerts can be set up in order to push an alert every time this happens. The default color for this is “Fuchsia”. Because it contrasts well.
“Show visual accel/decel” default: True
Uses a few simple mathematical functions in order to calculate if the A/D is accelerating or decelerating. If enabled it will plot dots when the A/D is accelerating up or accelerating down: Meaning: When the change is more rapid than the previous change (hence acceleration).
"Invert acceleration dots" default: False
Changes the previous function mentioned: Let’s say you don’t want to know acceleration but you want to know the the A/D is decelerating (meaning: The change is less rapid than the previous change). You can enable this setting. If you enable this it will plot dots on the A/D when we’re decelerating instead of accelerating. (hence deceleration).
"Color entire background of A/D" default: False
In case you desire to plot the entire background of the indicator you can enable this setting. Might make it a little bit more easy to spot changes in the A/D (especially when using multiple indicators).
That’s all in terms of settings. Most of these settings also describe the use case.
The use case as described by TradingView is the following:
“The Accelerator Oscillator (AC) is an indicator developed by Bill Williams that helps traders gauge changes in momentum. It is based on the Awesome Oscillator (AO) and measures the difference between that indicator and its 5-period moving average, effectively showing how quickly the AO changes and predicting what it will do next. If the AC is in positive territory, the upward acceleration is likely to continue. If the AC is in negative territory, the downward acceleration is likely to continue. The bars in the histogram have 2 colors: red indicating a fall in price and green indicating a rise in price. Various specific buy and sell signals can be derived from the color of the bars and whether they are above or below the 0-line.”
I’ve decided to add any alert I could think of: Meaning there are in total 22 customizable alerts to set up when using this indicator. If you have any conditions that I forgot to add feel free to leave a comment.
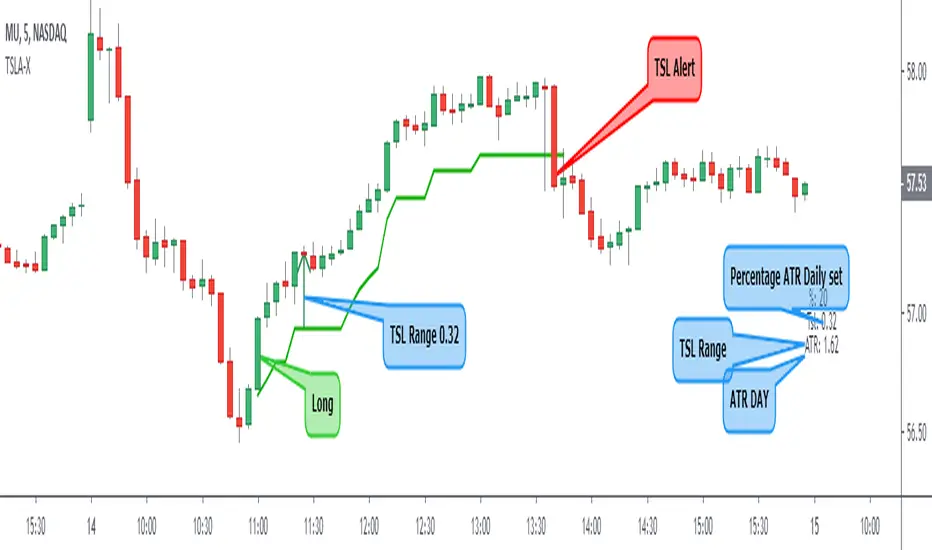
Trailing Stop Loss ATR + AlertI share this TSL indicator with alert (I use it only for Stocks), the configuration is very simple, you must select if it is a Short or Long operation, time at which the operation was opened,% of the daily ATR for TSL. It also contains:
- Alert
- Panel Info
Study for Squeeze Momentum Indicator [LazyBear]This study is based on LazyBear Squeeze Momentum Indicator and my strategy developed using it.
I added some custom feature and filters.
Main improvements are:
1- study is updated to version 4 of pine script;
2- I added alerts for entry rules and exit rules.
3- Alert syntax can be customized for webhooks: I added one example only for long entry.
You can customize a lot of features to get a profitable strategy.
Here is a link to original study.
Please use comment section for any feedback.

Simple EMA CrossQuick script I put together to complete the following:
---
- Simple EMA with the option to either display both or consolidate them as one
- Single EMA will change color based on a cross of the two EMA values entered
- Programmed alerts for bullish/bearish crossover
Enjoy!
Keltner Channel Alerts [QuantNomad]This is a script with alerts for standard Keltner Channer Strategy you can find in TradingView.
Use "Once Per Bar" option when creating alerts.

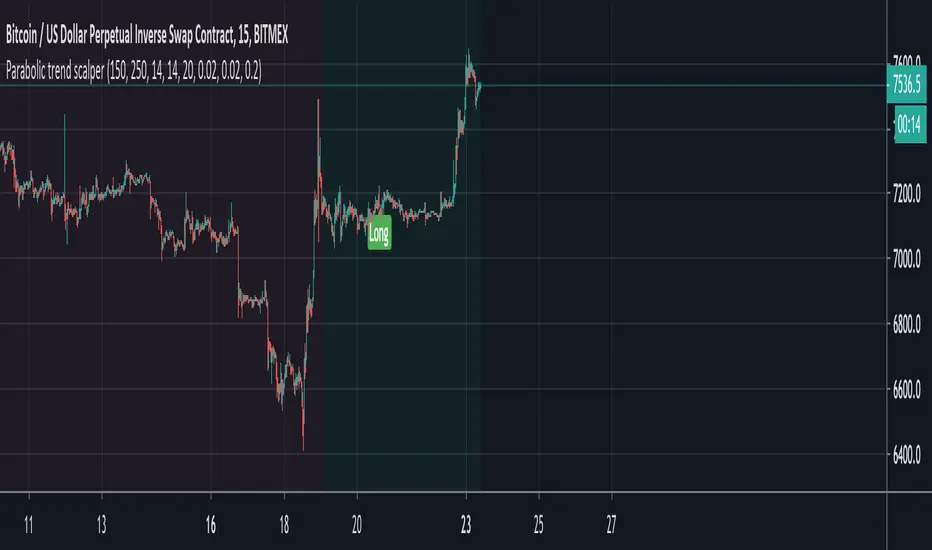
Parabolic trend scalperThis is based on a well known 5 min forex scalping strategy that analyses the general trend and goes long/short in that direction. Trades are filtered against a number of fundamentals to minimise the chances of weak signals.
Dark green = Upward trend
Light green = Long signal
Dark red = Downward trend
Light red = Short signal
Alerts are built in and should be set to 'once per candle' if trading with a bot. Ensure that your setup ignores alerts for positions already open in the same direction.