[SignalFI] Simple MA X [3 Stage]Welcome!
This strategy recently came up as a way to stage entries when using simple moving averages for trading on high time-frames.
The goal of this script is to provide early warning for Simple Moving Average (SMA) crosses.
Three events are taken in account:
1) Close crossing above or below the "Fast" SMA
2) Close crossing above or below the "Slow" SMA
3) "Fast" SMA crossing above or below the "Slow" SMA
In this way, you will receive early warning of the main SMA crosses as price rises above or falls below each of the SMAs defined.
The script is fully alertable on each of the defined crosses:
1) Early Bull/Bear = Close crossing above or below the "Fast" SMA
2) Mild Bull/Bear = Close crossing above or below the "Slow" SMA
3) Bull/Bear MA = "Fast" SMA crossing above or below the "Slow" SMA
The idea is that you can split your order entry/exit conditions into stages, during bull markets taking a (example) 33% position when the Early Bull alert fires, 33% at Mild Bull, and the last 33% at Bull MA alerts. Reversing the process when exiting in order to reduce the lagging nature of the standard SMA cross strategy.
Alerts

BEST Long Term Levels Breakout ScreenerHello traders
Continuing deeper and stronger with the screeners' educational serie one more time (#daft #punk #private #joke)
We don't have to wait for TradingView to allow screener based on custom indicator - we can build our own ^^
I - Long Terms concept
I had the idea from @scarff.
I think it's genius and I use this long terms level in my trading across all assets.
The screener, in particular, analyzes whenever the price breaks out a weekly/monthly/quarterly/yearly level on candle close .
Triggering events on candle close = we get rid of the REPAINTING = we remove the fake signals (in that case the fake breakouts).
The candle close is based on the close of the current chart => if the chart displays candlesticks on the weekly timeframe, then the considered close will be the weekly close.
If in daily timeframe, the close will be .............................. 4h (#wrong)..... kidding :) .............. DAILY obviously
II - How did I set the screener
The visual signals are as follow:
- square: breakout of a high/low weekly level
- circle: breakout of a high/low monthly level
- diamond: breakout of a high/low quarterly level
- flag: breakout of a high/low yearly level
- dash: none of the above
Then the colors are:
- green when bullish
- red when bearish
- orange/dash when none of the above
Cool Hacks
"But sir... what can we do with only 3 instruments for a screener?" I agree not much but...
As said previously... you can add multiple times the same indicator on a chart :)
Wishing you all the BEST trading and.... wait for it... BEST weekend
Dave

BEST Cloud ALL MAHello traders
Hope you're all doing well
This script is a generic cloud generator using a pre-selected set of moving averages (I probably forgot a lot but listed all the ones I used at least once).
A cloud is a visual representation of the gap between two moving averages - it shows right away how big in that gap (=how far they are from each other)
The challenge is to find a cloud such as the price often stay stuck between those 2 MA - and when it's getting finally out (up or down), it would be strong enough to signal a beginning of a trend.
This is a cool intellectual challenge for all aspiring traders
For that script, I defined a trend according to how the 2 MAs are located relative to each other (MA1 > MA2 or MA1 < MA2) and if the price gets out of the cloud.
You'll get :
- the option to color the candles based on a trend
- cool triangles entry signals
- and alerts on those triangles
All the BEST
Dave

BEST Ultimate Engulfing ScreenerHello traders
Continuing deeper and stronger with the screeners serie. I keep getting requests private messages and requests saying that screeners aren't possible with TradingView.
My answer is always... "Reallyyy ??" (I never find a better answer than that...)
I'll publish a few screeners just for everyone to understand what can be done with Pinescript. We don't have to wait for TradingView to allow screener based on custom indicator - we can build our own ^^
I - What is an engulfing pattern
Let's start with a screener to check for a very famous candlestick pattern called engulfing
Engulfing candles tend to signal a reversal of the current trend in the market. This specific pattern involves two candles with the latter candle ‘engulfing’ the entire body of the candle before it.
The engulfing candle can be bullish or bearish depending on where it forms in relation to the existing trend
Source and more info here
These engulfing candles indicate a strong shift in direction, and when combined with observation of the price-trending direction that precedes it, this shift creates the opportunity for a trading strategy.
II - How did I set the screener
I added an optional filter being Price vs SMA. The idea is to select only the engulfing whenever the price also breaks an SMA - this usually translates a stronger move - but could sometimes give the signal too late (#meh #trading #ain't #easy)
The visual signals are as follow:
- square: whenever the engine detects an engulfing and an SMA breakout
- triangle: the engine only detects an engulfing
- dash: none of the above
Then the colors are:
- orange when bullish
- yellow when bearish
- aqua/dash when none of the above
Cool Hacks
"But sir... what can we do with only 5 instruments for a screener?" I agree not much but...
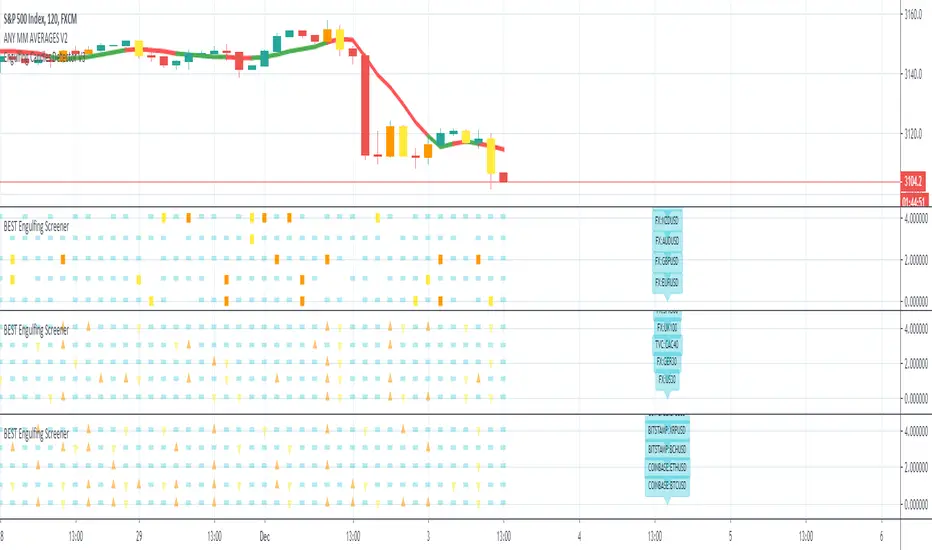
even if I allow only 5 instruments per indicator - nothing prevents you from adding multiple times the same indicator and changing the selected instruments for each. I also show why the SPX500 gave a yellow triangle (bearish engulfing) and how to match it with the screener.
=> imgur.com
Wishing you all the BEST trading
Dave
CYBER ENSEMBLE {PREVIEW}This is the PREVIEW version of CYBER ENSEMBLE
The subscription based PREMIUM version is found here:
Please PM me for access information.
Signals for the last 5 days are disabled.
Signal Alerts are disabled.
===============
CYBER ENSEMBLE is a sophisticated signalling script base on the interplay of an ensemble of optimized indicators and market state filters.
(>1000 lines of code)
Users are advised to manually back-test and optimize the settings for a particular chart and time frame, before proceeding with its use.
The algorithms will be periodically updated to further optimize and improve their performances, and new algorithms may be tested and added in the future.
Note: In no way is this intended as a financial/investment/trading advice. You are responsible for your own investment/trade decisions.

CYBER ENSEMBLE {PREMIUM}CYBER ENSEMBLE is a sophisticated signalling script base on the interplay of an ensemble of optimized indicators and market state filters.
(>1000 lines of code)
Users are advised to manually back-test and optimize the settings for a particular chart and time frame, before proceeding with its use.
The algorithms will be periodically updated to further optimize and improve their performances, and new algorithms may be tested and added in the future.
Note: In no way is this intended as a financial/investment/trading advice. You are responsible for your own investment/trade decisions.
Please PM me for access information.

Rhaps SMAEMA Combo v1.1There's many versions of this sort of thing around the Tradingview library, but i guess we all like things to our own specifications.
So this is my take on the SMA and EMA version combined.
Bunch of SMA's & EMA's, with labels, and G&D Cross Labels and Alerts.
These values can of course be changed to any you may prefer.
Rhapsodyy's Combo SMAEMA's v1.1
SMA's with Painted Labels : 10/30/50/80/200
EMA's with Painted Labels : 21/50/89/200/377
50SMA / 200SMA Golden & Death Crosses on Current Timeframe & Alerts
Daily 50SMA / 200SMA Golden & Death Crosses overlayed onto Current Timeframe & Alerts
50EMA / 200EMA Golden & Death Crosses on Current Timeframe & Alerts
Daily 50EMA / 200EMA Golden & Death Crosses overlayed onto Current Timeframe & Alerts

Buy & Sell - XMRBTC 1DPrivate Indicator
Indicator optimised for trading XMRBTC in 1D (daily) timeframe.
Buy and Sell signals as automated alerts.
Indicator optimised for trading XMRBTC in 1D timeframe.
The goal was to beat Buy & Hold on the whole period of the backtest. Results below!
The strategy is using a combo of Donchian Channels and Heikin Ashi, this is why there is a colored channel which can also be used to highlight the trend.
To get this indicator, use the links below, thanks !

MFI/RSIThis is a simple study that combines MFI and RSI and provides buy/sell alerts.
The red lines are MFI.
the blue lines are RSI.
Boundries are colored as the indicators and are user configurable.
Black triabgles are buy/sell points when both MFI and RSI are overbought/sold.

Cyatophilum BITCOIN Daily IndicatorFree indicator
To get it, add it to your favorites using the button below, then you will find it on your chart in the "favorites scripts" tab
I wanted to have a tool that would quickly show me an overview of the Bitcoin chart each day, and receive alerts when something was happening, so I made this indicator.
Optimized for Bitcoin / USD on the daily timeframe, this indicator uses many technical tools such as a double Donchian channel, momentum, volume, RSI, divergences and moving averages.
HOW TO USE
Signals - You can create Automated Alerts corresponding to the graphic labels on chart.
BUY: Most bullish signal. Go long or buy bitcoin if you haven't already.
⚠️ REVERSAL: The bear trend might be over soon. Prepare some stable coins on your exchange to make sure you are ready to trade.
⚠️ RISE: Very bullish signal meaning a lot of people are buying. At this point you should just follow the sheep herd and buy.
⚠️ DROP: A drop is very likely to happen. Take your profits even though the rally can continue. Most of the time the price will drop significantly.
SELL: Most bearish signal. Go short or sell bitcoin.
Note: Use 'Once per bar close' option when creating alerts to get the exact same signals as on the chart, but only at candle close. Otherwise use 'Oncer per bar' to get them as soon as possible but the graphic-signal can disappear (unvalidated) at candle close.
Parameters
"Show 3 EMAs": Show a 50, 100 and 200 EMA. Usefull for golden/death cross.
"Channel_Length" Length in bars for the double Donchian Channel. Default is 30.
Any feedback is welcome!
To get access to my private strategies, use the link below

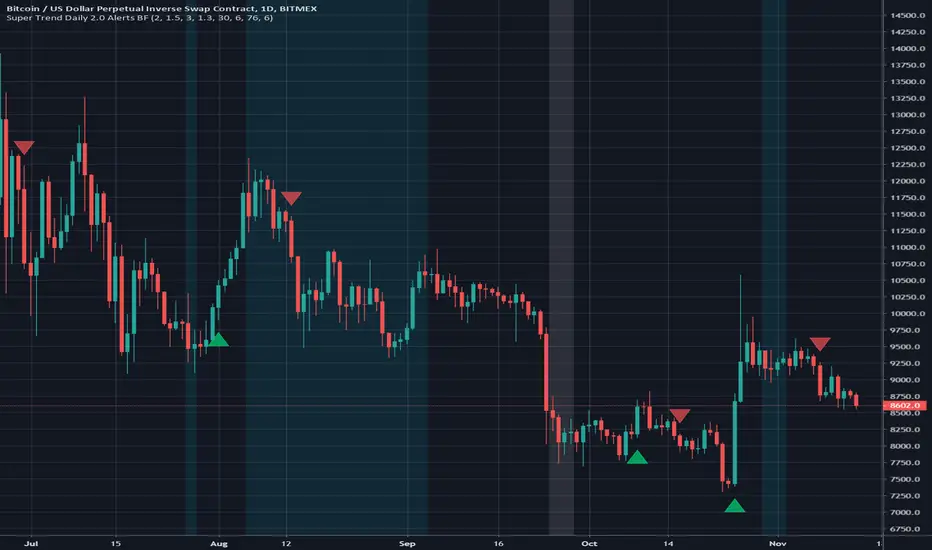
Super Trend Daily 2.0 Alerts BFThis is an alerts script for my Super Trend 2.0 indicator . It is intended as a companion script so you can backtest using the Strategy script and generate alerts using this Study script.
This Study script has the same default settings as the Strategy script and its only purpose is to provide alerts for the long and short signals the Strategy generates. Obviously, if you want to generate alerts based on a Strategy backtest, please ensure the settings are the same in the Study as in the Strategy.
For illustration, I have plotted arrows on the chart for long and short signals, and also colored the background to show when the rate of change function determines a choppy/sideways market.
ALERTS
There are 2 alerts set up:
Long Entry
Short Entry
ILLUSTRATION
Green arrow = Long Entry
Red arrow = Short Entry
White background = No short trades
Aqua background = No long trades
EXAMPLE USE CASE
1. Open a Bitcoin/USD chart on 1D timeframe.
2. Open this script and the Super Trend 2.0 indicator script.
3. Backtest with the Strategy Backtester and change the settings if you like until you get a desirable outcome for your own purposes.
4. Once you are happy with the backtest, change the settings in the Alerts script (this one) so they match the Strategy settings.
5. Set up the alerts according to your preferences.
Cyatophilum Ultimate Trading Bot [ALERTSETUP]Private Indicator.
This is an indicator for trading low timeframes . It is generic and configurable meaning you can use it not only on crypto, but also forex, CFD, stocks etc.
HOW IT WORKS
The user chooses between three powerful base strategies: Bollinger Bands + Stoch RSI, RSI Divergences or the SARMA Strategy .
He can also trade support and resistance breakouts , with or without the base strategy.
Use the Alert Setup version to trigger entry and exit alerts .
You can choose between a set of trend lines that will filter trades that are against the main trend in order to increase profitability.
The integrated Trailing Stop Loss will trigger an alert to exit the trade.
You can use the Trailing Take Profit with a configurable % deviation. It will also trigger an exit alert.
SAMPLE USE CASES
XBTUSD 5m BitMEX
XBTUSD 15m BitMEX
ETHUSD 5m BitMEX
ETHUSD 15m BitMEX
USD/WTI 1m IDC (Us Dollar/ WTI Crude OIL)
Backtest below for BITMEX:LTCZ19 in 15m timeframe.
Note: This is the Alert version. You can find the backtest version in my profile.
To get access to the indicator, use the link below, thanks for reading!

WaveTrend Oscillator + Divergence + Direction Detection +AlertsMake this version of the famous WaveTrend indicator has the following characteristics:
- WaveTrend direction detection
- Customizable overbought and oversold level (set by default just like the original version)
- Possibility to modify the length of the channel (set by default same as the original version)
- Possibility of modifying mobile period (set by default same as the original version)
- Show ONLY overbought sales.
- Show all sales.
- Show ONLY purchases in oversold.
- Show all purchases.
- See histogram.
- See half signal.
- Paint Bars.
- Modification of colors.
Alerts:
The indicator has the following alerts:
- Sales in oversold
- All Sales
- Purchases in oversold
- All Purchases
- Purchases / Overbought sales / Sales
- All Sales / Purchases
- Change WT Direction
NOTE: This single indicator should not be taken as a trading strategy is only a tool for the trader that gives a sense of depth market and potential opportunities for purchase / sale which must be evaluated in the context generally used this indicator to look for positions in areas of overbought / sell, also for detecting differences, other aspects such as the direction of Wavetrend, levels, histogram, etc, also provide useful information.
Release Notes: Add a field to change reaction and color change direction WT, is set to 1 as fast (default), better greater number address filter but is slower.
Release Notes: Add a Hidden Divergences detector and Regulars (bulls and the bears), from setup can activate them, also can turn off the labels and leave only the lines, configure it to your liking.
NOTE: SCRIPT IN SPANISH

MACDTraderPro for BTC with LONG & SHORT AlertsMostly based on MACD analysis this trend indicator accurately shows you when main trend changes.
It has LONG and SHORT labels and you can use it with tradingview alerts to be in touch and for automated trading bots.
You can use it both with margin(bitmex, bitfinex, etc) and main exchanges (binance and more) with bitcoin for now and soon for alts also.

Algorithm Builder CRYPTO (m5)Hello traders 👋
I. 💎 SCRIPTS ACCESS AND TRIALS 💎
1. Every 3 weeks trial request access has to be done through my website .
2. My website URL is in this script signature at the very bottom (you'll have to scroll down a bit and going past the long description) and in my profile status available here : Daveatt
3. Many video tutorials explaining clearly how all our indicators work are available on your website > guides section.
4. You may also contact me directly for more information regarding the trading method included in the indicator or how to access it
2.1 Forewords
This indicator is for the Intraday CRYPTO traders looking for fixed entries based on a trading method designed by 2 experienced traders.
It's a variation of our Algorithm Builder with a custom method for 5-minutes chart trading - can be coupled with the UNIVERSAL Algo Builder also,
We designed this framework for CRYPTO/USD and CRYPTO/CRYPTO pairing (ex: LTC/BTC, XRP/ETH, ...).
Made for crypto with enough trading volume (big and mid-caps)
ETH/BTC
XRP/ETH
EOS/USD
The tool works in m5 timeframe but won't work with any other timeframe . Even if applied on a 5-minutes chart; we included higher timeframe indicators to enter more securely.
It includes :
- our proprietary method with fixed entries
- a hard exit system (built-in stop-loss)
- 🔔 Compatible with dynamic alerts 🔔
Dynamic alerts are bringing automated trading to a whole new level. The third-party solutions capturing TradingView alerts are able to use them.
- (optional) we let the users decide to use or not our built-in Trade Manager.
Regardless of the Trade Manager is used or not, one must mandatory exit, once a vertical hard exit bar appears.
- the Algorithmic Supports and Resistances used as safeguards and take profit zones.
Final words
We made it as simple as we could (to be honest it's a very simple system for the end-user) - even with several hundreds of calculations in the indicator.
Please hit me up for any question/feedback/comment
Become the BEST trader that you deserve to be
Dave

Algorithm Builder UNIVERSAL (m30)Hello traders 👋
I. 💎 SCRIPTS ACCESS AND TRIALS 💎
1. Every 3 weeks trial request access has to be done through my website .
2. My website URL is in this script signature at the very bottom (you'll have to scroll down a bit and going past the long description) and in my profile status available here : Daveatt
3. Many video tutorials explaining clearly how all our indicators work are available on your website > guides section.
4. You may also contact me directly for more information regarding the trading method included in the indicator or how to access it
2.1 Forewords
This indicator/trading framework is available only to our PREMIUM users.
We decided to call it "UNIVERSAL" because the tool gives very decent signals for STOCKS/PENNY STOCKS/FOREX/CRYPTO (USD & BTC pairing)/INDICES/COMMODITIES trading
(the asset classes that I'm not listing are not tested yet; though we should cover a wide range of tradable assets here)
This is a by-product of defining an algorithmic trading method... we were surprised ourselves those past few weeks while trading with it.
The entries displayed are most of the time amazing, and the invalidations allow to reduce the losses considerably (more wins and less losses => delighted trader)
A few examples below showing why it's "universal"
FOREX
INDICES
COMMODITIES
CRYPTO (BTC pairing)
The tool works in m30 timeframe but won't work with any other timeframe . Even if applied on a 30-minutes chart; we included higher timeframe indicators to enter more securely.
It includes :
- our proprietary method with fixed entries
- a hard exit system (built-in stop-loss)
- 🔔 Compatible with dynamic alerts 🔔
Dynamic alerts are bringing automated trading to a whole new level. The third-party solutions capturing TradingView alerts are able to use them.
- (optional) we let the users decide to use or not our built-in Trade Manager.
Regardless of the Trade Manager is used or not, one must mandatory exit, once a vertical hard exit bar appears.
- the Algorithmic Supports and Resistances used as safeguards and take profit zones.
Final words
We made it as simple as we could (to be honest it's a very simple system for the end-user) - even with several hundreds of calculations in the indicator.
Please hit me up for any question/feedback/comment
Become the BEST trader that you can be
Dave

Relative Volume RVOL AlertsRelative Volume or RVOL is an indicator used to help determine the amount of volume change over a given period of time.
It is often used to help traders determine how in-play a ticker is.
General rule of thumb is the higher the RVOL, the more in play a stock is.
I myself like to use it as a substitute of the volume indicator itself.
Basic Calculation:
Relative Volume = Current Volume / Average Volume
Crossover Signals:
Any time there is a volume spike which causes a crossover of the user set 'Smoothed Moving Average' or 'Threshold' a green/red dot will appear at the top. The color of the dot is dependent on closing of the candle. Therefore it does not necessarily mean price will continue in that direction since volume spikes often happen in peaks or valleys.
Threshold:
The level at which custom alerts and signal can be set. The higher the value, the more volume required to trigger.
Built in Alerts:
You can set custom alerts for the crossovers of the adjustable threshold, or the average RVOL band.

ButterflyPattern_ULTRA V1 - auto lines drawing inclusive alerts
HI BIG PLAYERS AROUND THE WORLD,
this script allow to draw automatically lines of Butterfly pattern. The Butterfly pattern is part of Harmonic Pattern.
Parallel to the automatic drawing, the indicator can give signals as soon as the typically Fibonacci extension immediately reached or has been reached. This allows the indicator ButterflyPattern_ULTRA V1 to give early signals. In the default settings, the signals are displayed with a blue background on the chart.
ButterflyPattern_ULTRA V1 is offered for sale. More information can be found below in the signature.
However, anyone can test this indicator for once without any registration in a 3 day trial. You can request access with a simple message to me.
Another trial of 7 days is included in the offer on my website - before the first payment will done.
In the settings it is possible to change the degree of details. This is sometimes necessary because TradingView limited only 55 lines per indicator in Pinescript Version 4.
In extreme cases it is therefore possible to change the settings that the Butterfly pattern represent waves only with 5 lines. This allows the indicator to detect far more Butterfly pattern on the same chart.
For more great indicators everyone is invited to follow me on TradingView.
Kind regards
NXT2017

Trend Pulse Pro V2Trend Pulse Pro V2 (Non Repaint)
TradingView Account Needed: Free
You don't need to be an expert to use Trend Pulse Pro.
Just follow the signals and that's all and use simple Fibonacci levels to find stop loss and take profit!
You can increase the win rate even more by following some simple technical analysis, for example, when trend breaks (price break signal level) you can use that as support become resistance level (sell) or resistance becomes support (buy):
No complex things. No waste of time.
And although you won't win 100% of the trades (no signals can guarantee that), your trading will surely improve a lot!
Even someone with almost no trading experience can read the simple trading rules given in the included user guide, watch the how-to videos and follow Trend Pulse Pro’s signals to consistently make smarter trades.
With Trend Pulse Pro you will get accurate buy and sell signals every time there is a new trading opportunity so that you never miss any big price movements and makes your trading both easier and more profitable.
How to use the signals and alerts:
Trend Pulse Pro automatically analyze trend and price action to give you a signal when there's a good trade.
These trend signals and alerts are derived from live data but the stability of our code allows it to not repaint.
Trend Pulse Pro allow you to easily determine the trend and will give you buy and sell entry levels.
Works on all markets on all time frames so it's suitable for scalpers, day and swing traders.
If you want more details, the link is in the signature.
Disclaimer:
Past performance is not indicative of future performance. No representation is being made that any results discussed within the service and its related media content will be achieved. All opinions, news, research, analyses, prices or other information is provided as general market commentary and not as investment advice. TradingWalk, their members, shareholders, employees, agents, representatives and resellers do not warrant the completeness, accuracy or timeliness of the information supplied, and they shall not be liable for any loss or damages, consequential or otherwise, which may arise from the use or reliance of the TradingWalk service and its content. © 2019 TradingWalk.
TradingWalk indicators are built for TradingView. TradingWalk is on no way a part of TradingView.

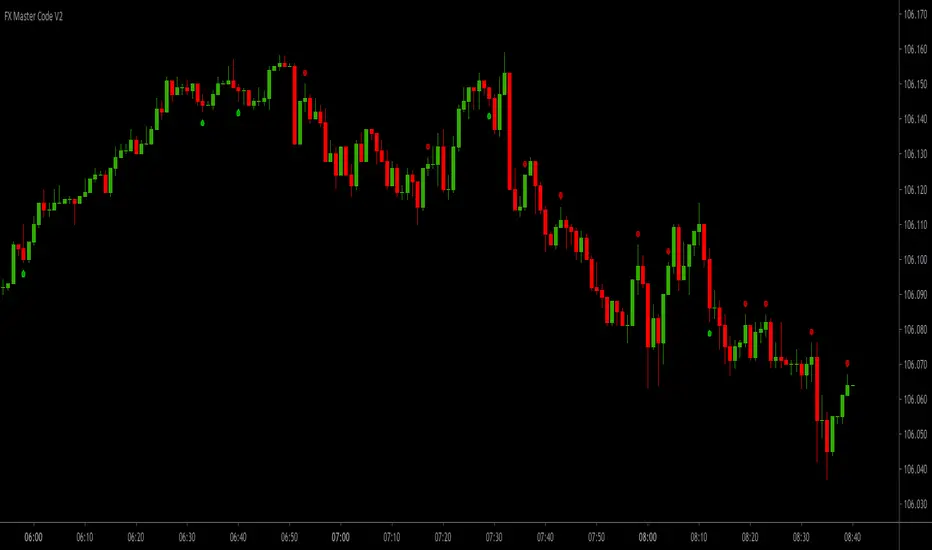
FX Master Code V2FX Master Code V2 (Non Repaint)
TradingView Account Needed: Free
Are you making the making the kind of results you want from trading right now?
Well, if the answer's no, then read this!
Even if you're a complete beginner in trading or an experienced trader, you can use these signals and alerts to start making great results.
The main goal of trading the 1-minute time frame is to make a profit through buying or selling currency pairs by holding a position for a very short period of time, and closing it for a profit.
FX Master Code will give you signals based on my proven and profitable 1-minute trading strategy.
You should be aware that this strategy will demand a certain amount of time and concentration. If you are not able to dedicate at least one hour a day to trade this strategy, then trading the 1-minute chart might not be the best strategy for you.
This is a day trading strategy suitable scalpers and binary options traders, as it involves opening a buy or sell position, gaining a few pips, and then closing the position 3 candlesticks after the signal (3 minute expiration time for binary options).
The exiting aspect of this is quantity. It is not unusual for traders to place more than +10 trades a day (and the more trades you place, the higher returns you can make).
Why not try FX Master Code and see if this system works for you?
The essence of the system will not allow for high losses. We will help you with risk management, use the best-practice risk and trade management for successful trading we give you with FX Master Code.
FX Master Code can be an extremely effective and profitable strategy – even for those who are beginners or use it purely as a supplementary strategy.
What is even better, using this strategy you are rewarded for quantitative work – the more trading you perform, the higher returns you can make.
If you want more details, the link is in the signature.
Disclaimer:
Past performance is not indicative of future performance. No representation is being made that any results discussed within the service and its related media content will be achieved. All opinions, news, research, analyses, prices or other information is provided as general market commentary and not as investment advice. TradingWalk, their members, shareholders, employees, agents, representatives and resellers do not warrant the completeness, accuracy or timeliness of the information supplied, and they shall not be liable for any loss or damages, consequential or otherwise, which may arise from the use or reliance of the TradingWalk service and its content. © 2019 TradingWalk.
TradingWalk indicators are built for TradingView. TradingWalk is on no way a part of TradingView.
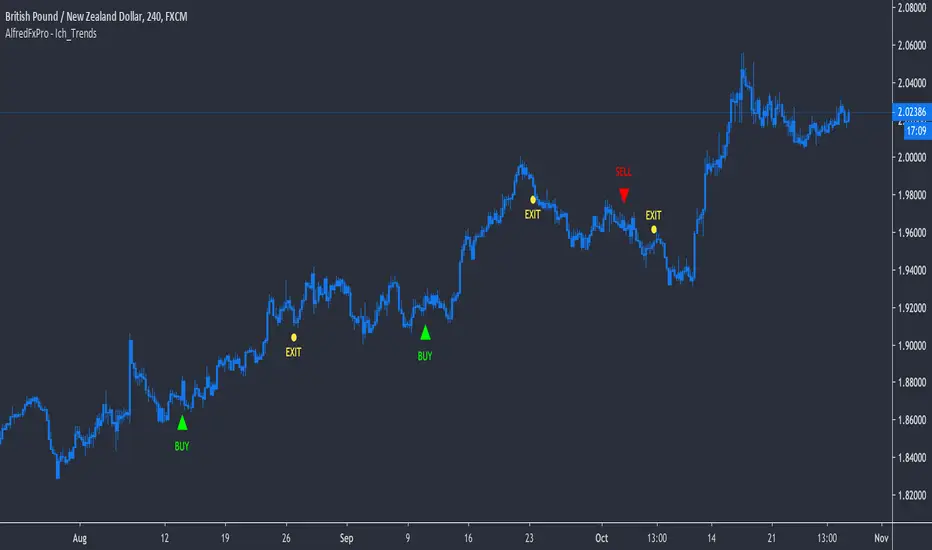
AlfredFxPro - Ichimoku_Trends_AlertsOur powerful Ichimoku Trend Following Scalping Indicator now with LIVE Alerts ( Buy, Sell, Exit Buy, Exit Sell) straight to your PC + Mobile.
*** NO REPAINT *** What you see is what you get. It will fire a signal as soon as the bar close
The (AlfredFxPro - Ich_Trends) uses one element of the famous Ichimoku and combine the signal with two custom volatility indicators to predict potential trends and determine the strength of the trend to keep you in as long as the trend is running or get you out as soon as possible with min loss.
Combine the signal with price action breakout patterns and you have a solid indicator.
It's a very powerful tool to add to your analysis, and make it your own.
**Try on Demo First**
Works best on high volatility instruments
Works on All Assets ( Forex, Crypto, Commodities , Gold , Stocks)
Suggested Timeframes (15min, 30min, 1Hr, 4Hr, D)
*************************
Send us a message for Access!
THIS INDICATOR IS PRIVATE & AVAILABLE FOR MEMBERS ONLY!
**************************
How to Set Alerts :
**Example Buy Signal Alert
-> Go to GBP/NZD 4Hr Timeframe
-> Click Add new Alert
-> Condition -> Select : AlfredFxPro - Ich_Trends
-> Select : Buy Alert
-> Option : Once Per Bar Close
-> Notify on App + POP Up
-> Message: Write: ""Buy 4Hr""
-------------------------------------------
**Example Exit Buy Signal Alert
-> Go to GBP/NZD 4Hr Timeframe
-> Click Add new Alert
-> Condition -> Select : AlfredFxPro - Ich_Trends
-> Select : Long Exit Alert
-> Option : Once Per Bar Close
-> Notify on App + POP Up
-> Message: Write : ""Exit Buy 4Hr""
-------------------------------------------
You repeat the same process for "Sell, and Exit Sell" for any pair on any timeframe you want.
-------------------------------------------
**********Important***********
1) Enter on a Buy and Exit from the same time frame don't mix signals from time frames ( Treat each time frame as an individual trade).
2) Important to set the Alert option: ""Once Per Bar Close"", otherwise you'll get wrong signals.
*************************
Send us a message for Access!
THIS INDICATOR IS PRIVATE & AVAILABLE FOR MEMBERS ONLY!
**************************
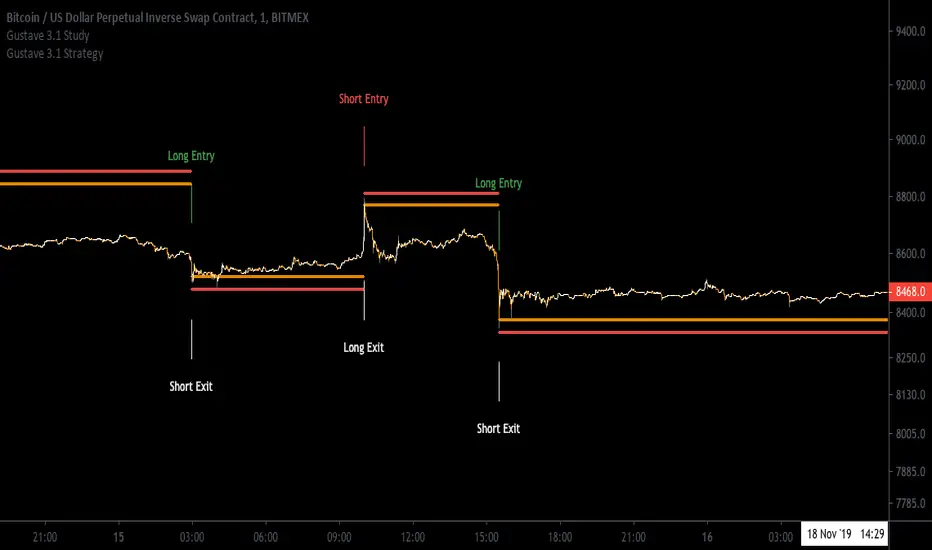
[Aill3urs V.1.0.P] Study GustaveIt's the Study of the this Strategy-Gustave you can find below.
For any info DM me.