NL - SSMTTHE PATH OF PRICE
───────────────────────────────
I've spent years studying the market.
I didn't want signals. I wanted to understand. The "why" behind the movement.
There are masters who explain this. Few. Scattered across hundreds of hours of content.
I studied them. I understood their ideas. And I realized something was missing: a way to see it all together, on the chart, clearly.
So I built it.
I took the best from each one. Added my own logic that helped me see what they weren't showing. And I turned it into an indicator that shows me the path.
Price doesn't move against you. It's an algorithm. It moves following a rhythm. Cycles, quarters, models. An order you can learn to see.
This indicator doesn't give you signals. It shows you what price is telling you. Where it's heading.
It's not for chasing entries. It's for understanding.
And when you understand, trading becomes simple.
───────────────────────────────
THE COLLECTION
Four tools. One system.
◆ Cloud — Where price can stall or react.
◆ Quarters & Cycles — The rhythm. When and where to expect movement.
◆ SSMT — Confirmation. What other assets are doing.
◆ True Opens — Your starting point. Discount or premium.
Each one works alone. Together, they tell you the full story.
Algorithm

NL - TO THE PATH OF PRICE
───────────────────────────────
I've spent years studying the market.
I didn't want signals. I wanted to understand. The "why" behind the movement.
There are masters who explain this. Few. Scattered across hundreds of hours of content.
I studied them. I understood their ideas. And I realized something was missing: a way to see it all together, on the chart, clearly.
So I built it.
I took the best from each one. Added my own logic that helped me see what they weren't showing. And I turned it into an indicator that shows me the path.
Price doesn't move against you. It's an algorithm. It moves following a rhythm. Cycles, quarters, models. An order you can learn to see.
This indicator doesn't give you signals. It shows you what price is telling you. Where it's heading.
It's not for chasing entries. It's for understanding.
And when you understand, trading becomes simple.
───────────────────────────────
THE COLLECTION
Four tools. One system.
◆ Cloud — Where price can stall or react.
◆ Quarters & Cycles — The rhythm. When and where to expect movement.
◆ SSMT — Confirmation. What other assets are doing.
◆ True Opens — Your starting point. Discount or premium.
Each one works alone. Together, they tell you the full story.

NL NubeTHE PATH OF PRICE
───────────────────────────────
I've spent years studying the market.
I didn't want signals. I wanted to understand. The "why" behind the movement.
There are masters who explain this. Few. Scattered across hundreds of hours of content.
I studied them. I understood their ideas. And I realized something was missing: a way to see it all together, on the chart, clearly.
So I built it.
I took the best from each one. Added my own logic that helped me see what they weren't showing. And I turned it into an indicator that shows me the path.
Price doesn't move against you. It's an algorithm. It moves following a rhythm. Cycles, quarters, models. An order you can learn to see.
This indicator doesn't give you signals. It shows you what price is telling you. Where it's heading.
It's not for chasing entries. It's for understanding.
And when you understand, trading becomes simple.
───────────────────────────────
THE COLLECTION
Four tools. One system.
◆ Cloud — Where price can stall or react.
◆ Quarters & Cycles — The rhythm. When and where to expect movement.
◆ SSMT — Confirmation. What other assets are doing.
◆ True Opens — Your starting point. Discount or premium.
Each one works alone. Together, they tell you the full story.

Algo Smart Pro🚀 Algo Smart Pro: The Ghost Algorithm
Algo Smart Pro is not just another indicator; it is a sophisticated Neural-based Algorithm designed to decode institutional market behavior.
By integrating advanced Order Flow Analysis with Smart Money Concepts (SMC), it exposes the hidden liquidity traps set by big banks.
Key Algorithmic Features:
Institutional Liquidity Detection: Tracks where the "Smart Money" is building positions before the move.
Dynamic Order Block Filtering: Unlike static indicators, our algorithm filters out weak blocks and highlights high-probability displacement zones.
Real-time Delta Volume Engine: Monitors the raw buying/selling pressure behind every candle.
Automated Risk-to-Reward Ratio: Precision entry with 3-layered institutional targets.
Link :
Telegram
WhatsApp
www.Algofxglobal.com

ICT Macro Tracker - Study Version (Original by toodegrees)This indicator is a modified study version of the ICT Algorithmic Macro Tracker by toodegrees, based on the original open-source script available at The original indicator plots ICT Macro windows on the chart, corresponding to specific time [ periods when the Interbank Price Delivery Algorithm undergoes checks/instructions (aka "macros") for the price engine to reprice to an area of liquidity or inefficiency.
This study version adds functionality to hide bars outside macro periods. When enabled, the indicator draws boxes that cover the full chart height during non-macro periods, obscuring those bars so only macro periods are visible. This helps focus on macro-only price action. The feature is configurable, allowing users to enable or disable it and customize the box color. All original functionality remains intact.

Omni-Divergence Pro [Hodldean]Omni-Divergence Pro
Most traders rely on a single indicator (like RSI or MACD) to make decisions. The problem? Single indicators are noisy, prone to false signals, and fail in changing market conditions.
Omni-Divergence Pro is different. It does not rely on one data point. Instead, it deploys a Consensus Engine—an underlying algorithm that aggregates 11 professional-grade market models into a single "Vote."
Only when the Price Action structurally disagrees with this Mathematical Consensus do you get a signal.
How It Works: The 3-Layer Filter
This script is designed to filter out 90% of market noise and only present high-probability setups using a proprietary 3-step validation process:
1. The Consensus Engine (11-Factor Model) Instead of just looking at momentum, we calculate a normalized score based on 11 distinct market dimensions, ranging from standard trend followers to advanced Digital Signal Processing (DSP):
Trend: Hull MA (HMA), Kaufman Adaptive MA (KAMA), Ichimoku Cloud.
Momentum: Smoothed RSI, Stochastic RSI, Donchian Channels.
Advanced DSP: Ehlers Super Smoother, Ehlers Fisher Transform, Ehlers Cyber Cycle.
Next-Gen Filters: Laguerre Filter, ALMA (Arnaud Legoux / JMA Proxy).
2. Structural Divergence (The Trigger) We do not look for simple "oversold" levels. We look for Structural Disagreement.
Bullish Signal: Price makes a Lower Low, but the Consensus of 11 indicators makes a Higher Low. The underlying data is screaming "Strength" while price is still dropping.
Bearish Signal: Price makes a Higher High, but the Consensus fails to confirm it.
3. The Volume Veto (The Confirmation) A divergence without volume is a trap. This system includes an integrated RVOL (Relative Volume) Filter.
If a signal forms on low volume (weekend/lunch hour), it is rejected.
Signals are only valid if Institutional Volume supports the move.
Features at a Glance
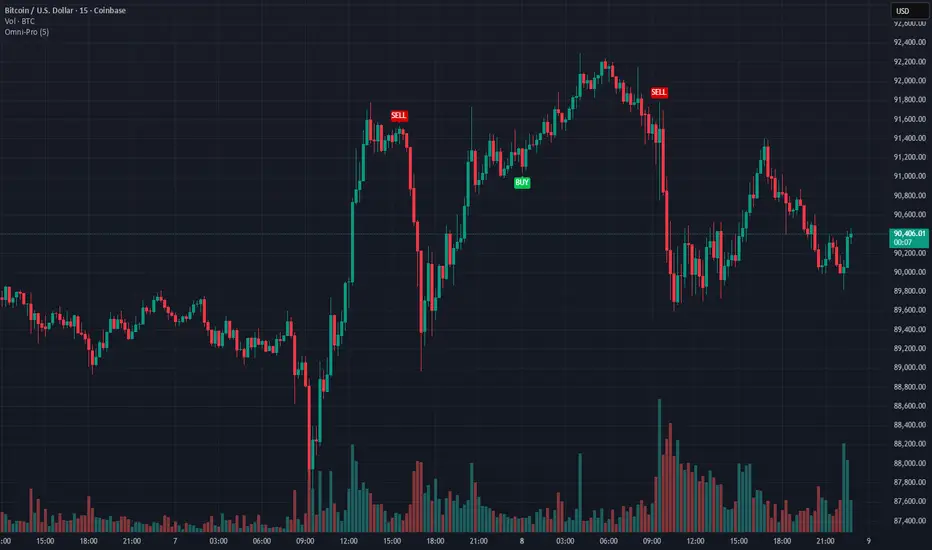
Clean Charts: No messy lines or oscillators. You only see "BUY" and "SELL" labels when a validated signal occurs.
Dual-Mode Detection:
Regular Divergence: For catching tops and bottoms (Reversals).
Hidden Divergence: For entering pullbacks in a strong trend (Trend Continuation).
Zero Repainting Logic: Signals are generated based on strict pivot confirmation. Once a signal is printed and the candle closes, it never disappears.
Technical Specifications
Confirmation Lag: This system prioritizes accuracy over speed. Signals appear upon the confirmation of a Pivot High/Low (default: 5 bars).
Visual Offset: Labels are plotted in the past (offset) to pinpoint exactly where the structural top/bottom occurred, providing clear context for stop-loss placement.
Best Timeframes: Optimized for 15m, 1H, 4H, and Daily charts. (For higher timeframes like 4H/Daily, consider lowering the Lookback setting to 3).
⛔ ACCESS & PRICING
This is an Invite-Only script. To protect the proprietary "Consensus Engine" logic, the source code is hidden.
Trading involves risk. This tool is designed to assist in analysis, not to guarantee profits. Past performance is not indicative of future results.
Smart Auto Levels Renko Pro $ [ #Algo ] ( Fx, Alt, Crypto ) : Smart Levels is Smart Trades 🏆
"Smart Auto Levels Renko Pro $ ( Fx, Alt, Crypto ) " indicator is specially designed for " Crypto, Altcoins, Forex pairs, and US exchange" . It gives more power to day traders, pull-back / reverse trend traders / scalpers & trend analysts. This indicator plots the key smart levels , which will be automatically drawn at the session's start or during the session, if specific input is selected.
🔶 Usage and Settings :
A :
⇓ ( *refer 📷 image ) ⇓
B :
⇓ ( *refer 📷 images ) ⇓
🔷 Features :
a : automated smart levels with #algo compatibility.
b : plots Trend strength ▲, and current candle strength count value label.
c : ▄▀ RENKO Emulator engine ( plots *Non-repaintable #renko data as a line chart over the standard chart).
d : session 1st candle's High, Low & 50% levels ( irrespective of chart time-frame ).
e : 1-hour High & Low levels of specific candle ( from the drop-down menu ), for any global
market crypto / altcoins / forex or USA exchange symbols.
f : previous Day / Week / Month, chart High & Low.
g : pivot point levels of the Daily, Weekly & Monthly charts.
h : 2 class types of ⏰ alerts ( only signals or #algo execution ).
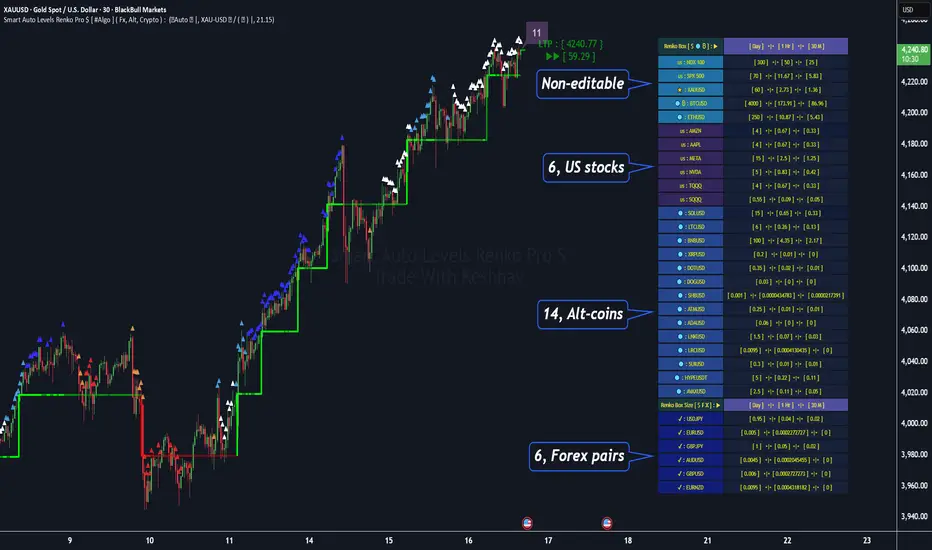
i : auto RENKO box size (ATR-based) table for 31 symbols (5 Default non-editable symbols,
6 US exchange symbols, 14 Alt-coins, 6 Forex pairs.)
j : auto processes " daylight saving time 🌓" data and plots accordingly.
💠Note: "For key smart levels, it processes data from a customized time frame, which is not available for the *free Trading View subscription users , and requires a premium plan." By this indicator, you have an edge over the paid subscription plan users and can automatically plot the Non-repaintable RENKO emulator for the current chart on the Trading View free Plan for any time-frame ."
⬇ Take a deep dive 👁️🗨️ into the Smart levels trading Basic Demonstration ⬇
▄▀ 1: "RENKO Emulator Engine" ⭐ , plots a noiseless chart for easy Top/Bottom set-up analysis. 11 types of 💼 asset classes options available in the drop-down menu.
LTP is tagged to the current RSI value ➕ volatility color change for instant quick decisions.
⇓ ( *refer 📷 image ) ⇓
🟣 2: "Trend Strength ▲ Label with color condition.
The strength of the trend will be shown as a number label ( for the current candle ), and the ▲ color format represents the strength of the trend. Can be utilized as an Entry or Exit condition.
⇓ ( *refer 📷 image ) ⇓
🟠 3: plots "Session first candle High, low, and 50%" levels ( irrespective of chart time-frame ), which are critical levels for an intraday trader with add-on levels of Previous Day, Week & Month High and Low levels.
⇓ ( *refer 📷 image ) ⇓
🔵 4: plots "Hourly chart candle" High & Low levels for the specific candles, selected from the drop-down menu with Pivot Points levels of Daily, Weekly, Monthly chart.
⇓ ( *refer 📷 image ) ⇓
🔲 5: "Auto RENKO box size" ( ATR based ) : This indicator is specially designed for 'Renko' trading enthusiasts, where the Box size of the ' Renko chart ' for intraday or swing trading ( ATR based ) , automatically calculated for the selected ( editable ) symbols in the table.
⇓ ( *refer 📷 image ) ⇓
*NOTE :
Table symbols (Non-editable) for 2 USA index, XAU, BTC, ETH.
Symbols (editable) for USA index/stocks.
Table Symbols (editable) for alt-coins.
Table Symbols (editable) for Forex pairs.
⏰ 6: "Alert functions."
⇓ ( *refer 📷 image ) ⇓
◻ : Total 7 signal alerts can be possible in a Single alert.
◻ : Total 10 #algo alerts , ( must ✔ tick the Consent check box for algo execution ).
Note: : alert with RSI ( *manual ✍ input value ) condition.
After selecting alert/alerts ( signals 7 / #algo 10 ), an additional RSI condition can also be used as an input to trigger the alert.
ex: alert = { 🟠 𝟭 Hr 🕯 H & L ➕ ✅ RSI✍ } condition, will trigger the alert when both conditions meet simultaneously.
This Indicator will work like a Trading System . It is different from other indicators, which give Signals only. This script is designed to be tailored to your personal trading style by combining user input components to create your own comprehensive strategy . The synergy between the components is key to its usefulness.
🚀 It focuses on the key Smart Levels and gives you an Extra edge over others.
✅ HOW TO GET ACCESS :
You can see the Author's instructions below to get instant access to this indicator & our premium indicator suites. If you like any of my Invite-Only indicators, kindly DM and let me know!
⚠ RISK DISCLAIMER :
All content provided by "@TradeWithKeshhav" is for informational & educational purposes only.
It does not constitute any financial advice or a solicitation to buy or sell any securities of any type. All investments / trading involve risks. Past performance does not guarantee future results / returns.
Regards :
Team @TradeWithKeshhav
Happy trading and investing!
Mutanabby_AI | Ultimate Algo | Remastered+Overview
The Mutanabby_AI Ultimate Algo Remastered+ represents a sophisticated trend-following system that combines Supertrend analysis with multiple moving average confirmations. This comprehensive indicator is designed specifically for identifying high-probability trend continuation and reversal opportunities across various market conditions.
Core Algorithm Components
**Supertrend Foundation**: The primary signal generation relies on a customizable Supertrend indicator with adjustable sensitivity (1-20 range). This adaptive trend-following tool uses Average True Range calculations to establish dynamic support and resistance levels that respond to market volatility.
**SMA Confirmation Matrix**: Multiple Simple Moving Averages (SMA 4, 5, 9, 13) provide layered confirmation for signal strength. The algorithm distinguishes between regular signals and "Strong" signals based on SMA 4 vs SMA 5 relationship, offering traders different conviction levels for position sizing.
**Trend Ribbon Visualization**: SMA 21 and SMA 34 create a visual trend ribbon that changes color based on their relationship. Green ribbon indicates bullish momentum while red signals bearish conditions, providing immediate visual trend context.
**RSI-Based Candle Coloring**: Advanced 61-tier RSI system colors candles with gradient precision from deep red (RSI ≤20) through purple transitions to bright green (RSI ≥79). This visual enhancement helps traders instantly assess momentum strength and overbought/oversold conditions.
Signal Generation Logic
**Buy Signal Criteria**:
- Price crosses above Supertrend line
- Close price must be above SMA 9 (trend confirmation)
- Signal strength determined by SMA 4 vs SMA 5 relationship
- "Strong Buy" when SMA 4 ≥ SMA 5
- Regular "Buy" when SMA 4 < SMA 5
**Sell Signal Criteria**:
- Price crosses below Supertrend line
- Close price must be below SMA 9 (trend confirmation)
- Signal strength based on SMA relationship
- "Strong Sell" when SMA 4 ≤ SMA 5
- Regular "Sell" when SMA 4 > SMA 5
Advanced Risk Management System
**Automated TP/SL Calculation**: The indicator automatically calculates stop loss and take profit levels using ATR-based measurements. Risk percentage and ATR length are fully customizable, allowing traders to adapt to different market conditions and personal risk tolerance.
**Multiple Take Profit Targets**:
- 1:1 Risk-Reward ratio for conservative profit taking
- 2:1 Risk-Reward for balanced trade management
- 3:1 Risk-Reward for maximum profit potential
**Visual Risk Display**: All risk management levels appear as both labels and optional trend lines on the chart. Customizable line styles (solid, dashed, dotted) and positioning ensure clear visualization without chart clutter.
**Dynamic Level Updates**: Risk levels automatically recalculate with each new signal, maintaining current market relevance throughout position lifecycles.
Visual Enhancement Features
**Customizable Display Options**: Toggle trend ribbon, TP/SL levels, and risk lines independently. Decimal precision adjustments (1-8 decimal places) accommodate different instrument price formats and personal preferences.
**Professional Label System**: Clean, informative labels show entry points, stop losses, and take profit targets with precise price levels. Labels automatically position themselves for optimal chart readability.
**Color-Coded Momentum**: The gradient RSI candle coloring system provides instant visual feedback on momentum strength, helping traders assess market energy and potential reversal zones.
Implementation Strategy
**Timeframe Optimization**: The algorithm performs effectively across multiple timeframes, with higher timeframes (4H, Daily) providing more reliable signals for swing trading. Lower timeframes work well for day trading with appropriate risk adjustments.
**Sensitivity Adjustment**: Lower sensitivity values (1-5) generate fewer but higher-quality signals, ideal for conservative approaches. Higher sensitivity (15-20) increases signal frequency for active trading styles.
**Risk Management Integration**: Use the automated risk calculations as baseline parameters, adjusting risk percentage based on account size and market conditions. The 1:1, 2:1, 3:1 targets enable systematic profit-taking strategies.
Market Application
**Trend Following Excellence**: Primary strength lies in capturing significant trend movements through the Supertrend foundation with SMA confirmation. The dual-layer approach reduces false signals common in single-indicator systems.
**Momentum Assessment**: RSI-based candle coloring provides immediate momentum context, helping traders assess signal strength and potential continuation probability.
**Range Detection**: The trend ribbon helps identify ranging conditions when SMA 21 and SMA 34 converge, alerting traders to potential breakout opportunities.
Performance Optimization
**Signal Quality**: The requirement for both Supertrend crossover AND SMA 9 confirmation significantly improves signal reliability compared to basic trend-following approaches.
**Visual Clarity**: The comprehensive visual system enables rapid market assessment without complex calculations, ideal for traders managing multiple instruments.
**Adaptability**: Extensive customization options allow fine-tuning for specific markets, trading styles, and risk preferences while maintaining the core algorithm integrity.
## Non-Repainting Design
**Educational Note**: This indicator uses standard TradingView functions (Supertrend, SMA, RSI) with normal behavior patterns. Real-time updates on current candles are expected and standard across all technical indicators. Historical signals on closed candles remain fixed and unchanged, ensuring reliable backtesting and analysis.
**Signal Confirmation**: Final signals are confirmed only when candles close, following standard technical analysis principles. The algorithm provides clear distinction between developing signals and confirmed entries.
Technical Specifications
**Supertrend Parameters**: Default sensitivity of 4 with ATR length of 11 provides balanced signal generation. Sensitivity range from 1-20 allows adaptation to different market volatilities and trading preferences.
**Moving Average Configuration**: SMA periods of 8, 9, and 13 create multi-layered trend confirmation, while SMA 21 and 34 form the visual trend ribbon for broader market context.
**Risk Management**: ATR-based calculations with customizable risk percentage ensure dynamic adaptation to market volatility while maintaining consistent risk exposure principles.
Recommended Settings
**Conservative Approach**: Sensitivity 4-5, RSI length 14, higher timeframes (4H, Daily) for swing trading with maximum signal reliability.
**Active Trading**: Sensitivity 6-8, RSI length 8-10, intermediate timeframes (1H) for balanced signal frequency and quality.
**Scalping Setup**: Sensitivity 10-15, RSI length 5-8, lower timeframes (15-30min) with enhanced risk management protocols.
## Conclusion
The Mutanabby_AI Ultimate Algo Remastered+ combines proven trend-following principles with modern visual enhancements and comprehensive risk management. The algorithm's strength lies in its multi-layered confirmation approach and automated risk calculations, providing both novice and experienced traders with clear signals and systematic trade management.
Success with this system requires understanding the relationship between signal strength indicators and adapting sensitivity settings to match current market conditions. The comprehensive visual feedback system enables rapid decision-making while the automated risk management ensures consistent trade parameters.
Practice with different sensitivity settings and timeframes to optimize performance for your specific trading style and risk tolerance. The algorithm's systematic approach provides an excellent framework for disciplined trend-following strategies across various market environments.

[UPRIGHT Trading] Volatility Trend Filter (VTF) AlgoHello Traders,
As some of you know, I have had this in Beta for a long while now and it's finally time for a full release.
I originally designed this to be an Unreal Algo add-on to track & stay in the trade a little better, but the VTF Algo has become a full Algorithm and can be used standalone with supreme accuracy.
It's for beginners and advanced traders alike. I've made the settings very customizable, but also easy to just jump right in.
How it works:
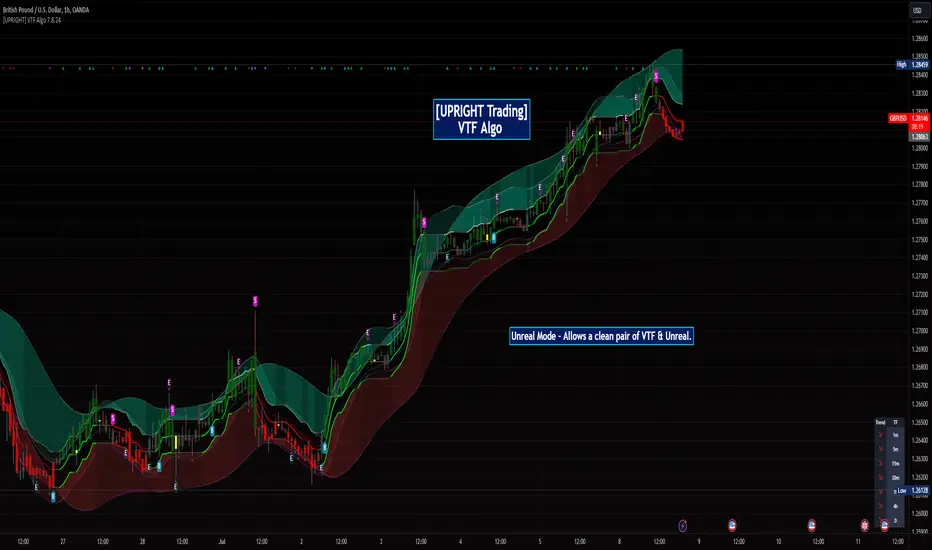
It uses volatility , deviations, and tons of statistical calculations, confirmations, moving averages, and filters to bring you the most accurate Supply & Demand predictive algorithm possible. The VTF Algo will automatically normalize different volatility in any type of market to help avoid getting Chopped up and give a forward-looking approach to accurate Price Action and confirmation. It will automatically show support and resistance in real-time. The channel that The VTF Algo creates will help traders confirm whether they should stay in the trade or get out fast. As the green top grows it naturally acts as Supply and as the red bottom grows it acts as Demand, when one of them far exceeds the other the direction price will proceed to is clear to see.
Features:
-Easy-to-read Price Action & Trend channel.
-Exceptional Chop Filter (grayed center).
-Accurate Buy/Sell and Topline Continuation Signals.
-Rejection Signals.
-Multiple-Timeframe Customizable Trend Table. Showing Directional Arrows (see bottom right of picture).
-Bullish / Bearish Growing Blocks.
-Fully Customizable with Clean and Cleaner Mode.
The VTF Algo was made with all different types of traders in mind.
Some like things Ultra Crispy Clean:
Others like things a little more clean but can move their focus to where it's needed:
Lastly, there are those who don't mind things looking a little busy:
Topline Continuation Signals, Auto-Supply/Demand, and a Real-Time Multiple Timeframe Trend Table (in the bottom-right) corner:
Meshes perfectly as an Algo Add-on for Unreal Algo © (as originally designed) to enhance "The Simple Strat" © :
I tried to make everything as customizable as possible. So adding or removing or color-changing is super easy.
Happy Trading.
Cheers,
Mike
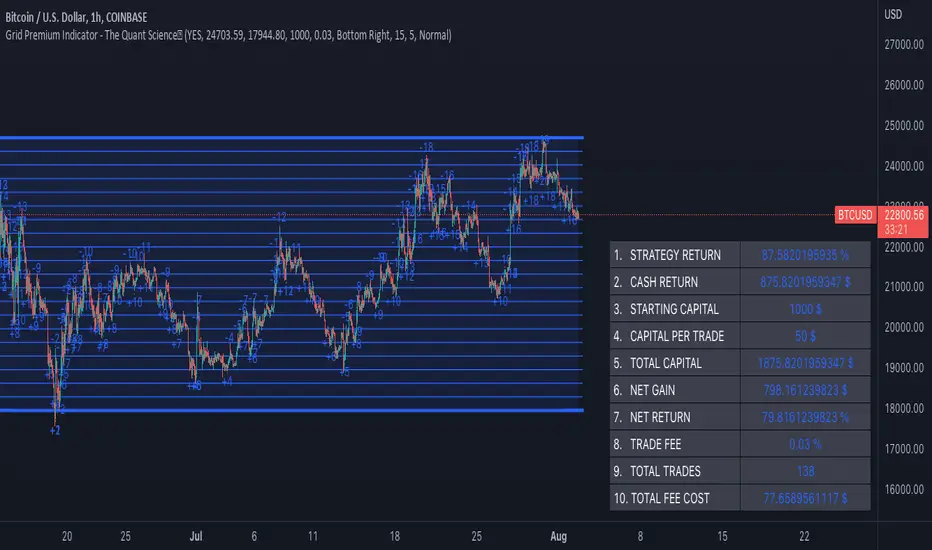
Grid Premium Indicator - The Quant ScienceGrid Premium Indicator - The Quant Science™ is an indicator that represent the grid trading strategy. Unlike our GRID SPOT TRADING ALGORITHM (which buys in a "buy the dip" style, offering a swing type operation) this indicator uses a trend following strategy with a larger number of grids.
A trend-following strategy in a grid algorithm allows you to open long positions if price rises and breaks up or open short positions if price breaks down.
This indicator was created following the guidelines of the best grid algorithms on 3Commas, Bitsgap, Kucoin, and Binance.
Our goal is to recreate a universal and trust model for all traders and investors who use grid algorithms for their trading.
The ideal market condition as for all grid algorithms is the side market. In the side market this algorithm will create profit during upward movements.
The trader using this algorithm can use it to:
1. Manual trading
2. Backtesting
3. Algorithmic trading
HOW TO SET UP
Using this indicator is very simple. We have configured the creation for a three-step set up. You can manage it without any problems experience in coding. All you have to do is click the grid start and end level and the indicator will automatically load generating the grids and backtesting.
OPERATIVITY
Each open trade is long and is opened when the price crossover an upward level. Each order is closed at the next level. If the price breaks upward or downward the extremes of the grid the algorithm stops trading and will not open any more positions.
FEATURES
Grids: this indicator generates 20 levels of grids.
Direction: opens exclusively long positions.
Strategy: trend-following.
Data table: a table collects all the quantitative data on the strategy's performance. By entering your broker's commission costs and initial capital you will have an instant report on the strategy's performance.
MAIN ADVANTAGE
Compound Interest: the high number of grids allows the gains from each trade to be reinvested quickly by speeding capitalization through compound interest.
LIMITATIONS OF THE MODEL
Like all grid strategies, maximum profit is made when the market is flat or sideways. A market with a bullish or bearish trend does not allow you to generate good profits with this strategy.
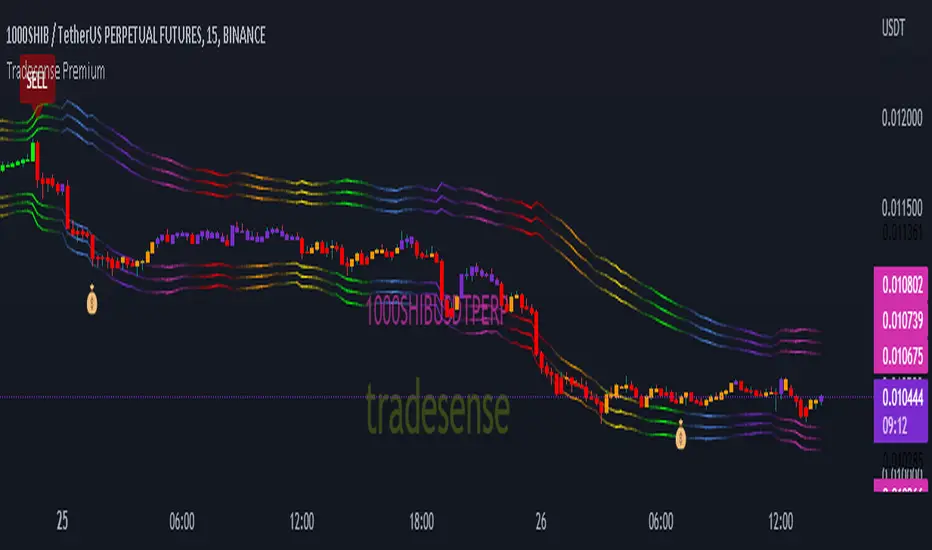
Tradesense PremiumTradesense Premium
Tradesense Premium indicator offers a buy & sell signal that is based from our senior analyst who have more than 10years of experience in Forex, Stock and Crypto trading and made it possible by our pine script developers.
Our script can detect market volatility based on the price direction and the absolute value of exponential moving average are multiplied to specific numbers to get a different trading style such as Scalper, Swing Trader and Trend Follower. We also filtered out all the signals using a different known indicators such as RSI, ATR, and ADX, and the results will allow you to enter a trade before the big moves occur. We also included all the important indicator which appears in real-time to get a competitive advantage in any market environment.
If you are a trader for a long time you should know that there is no way to avoid risk in trading. Every single trade could, theoretically at least, end up a loser. That is why our script also provides automatic risk management system which can gives you the ability to know exactly where to take the profit and to stop.
Trading style preset options - Will allows you to get the signals the way you wanted depending on your trading style. Ex. Scalper, Swing Trader or a Trend follower.
Bar color - Our bar colors are based on the price actions which detects the weakness of the bar or if the bar is ranging.
Reversal Zone - This indicator would identify possible price reversal zones.
Support & Resistance - This indicator draw a line at the pivot point to show possible support and resistance area.
Target Profit indicator based on price actions - This indicator will gives you an option to reduce your position or go out of the trade before the reversal happens.
Target Profit / Stop Loss based on ATR - This indicator will gives you a simple but effective risk management system to protect your capital. The TP/SL is based from the ATR.
Alert System - We are giving you an options to customize your alerts.
Our mission is to provide systematic way to build your success.
Release notes: Tradesense Premium V1.1
✅Trading style preset options
✅Bar color
✅Reversal Zone
✅Support & Resistance
✅Target Profit indicator based on price actions
✅Target Profit / Stop Loss based on ATR
✅Alert System
❓Trading style
Currently we have 3 sets of preset options that the user can use.
Scalp - this preset is made for the trader that wants a quick in and out of the trade. The best timeframe to this is 1min to 5mins chart.
Swing - this preset is for the trader who can wait a little bit longer in a trade. The best timeframe to use is 15mins to 1hour chart.
Trend - this preset is made for the busy people that can hold a trade more than a day. The best timeframe to use is 4hours to 1day chart.
❓Bar color
This options will change the color of your bars to lessen the noise of your chart.
Green Color is a bullish indicator
Red Color is a bearish indicator
Orange Color will signify that the trend is weakening
Purple Color is a consolidation/ranging price action
❓Reversal Zone
From the name it self, once the price is already hit the Reversal Zone the price will more likely to reverse or will make a correction.
❓Support & Resistance
When this option is enabled, the support and resistance levels will show up.
❓Target Profit indicator based on price actions
When this option is enabled, you will see a "💰" which means it's time to take profit or reduce your positions.
❓Target Profit / Stop Loss based on ATR
Most of the trader uses ATR as a stop loss level. When this option is enabled, the indicator for Stop Loss and Take Profit will show up and the TP/SL levels can be changed by changing the ATR Multiplier (Default is 1.8).
❓Alert System
Function alert is added and the user can customize it the way they want it.
Volatility indicator based on ATR Hello,
I'm sharing to you a volatility indicator I've done in the last few weeks based on ATR. There is multiple functionalities on this indicator, the first one is an overlay displaying when an asset is in an "overvolatily zone"
(displayed with red cross) and when we are in an "undervolatily zone" (displayed with green cross). You can change the sensibility of the signals in the parameters if you wish to have more or less greedy signals
(it will only modify the overvolatility signals). By the way those signals are not working for week-ends because volatility works differently on week-ends and it's not a good idea to count week-ends in the calculations, so do not worry if you see no signals on weekends.
Second part of the indicator is something I called "Atr bands" it's an equivalent to the famous Bollinger-Bands but based on ATR. I haven't backtested them yet but they seems really interesting in low ut
(15 mins seems to be the best ut for those) and they seems pretty bad in high ut so they can maybe be useful for low ut scalping.
Last thing, there is a parameter allowing you to display bands on the week-ends so you can easily see where the indicator won't give signals.
I would be really happy if I could have some feedsback if you try the indicator :)
Have a wonderful day

Unreal Algo [UPRIGHT] (cc)Hello Traders,
It's finally that time, I'm releasing my baby out into the world.
Unreal Algo is the answer to the question you didn't know you were asking.
It's for beginners and advanced traders alike. I've made the settings very customizable, but also easy to just jump right in.
How it works:
It uses tons of calculations, confirmations, and filters to bring you the most accurate predictive algorithm possible. The algo will automatically adjust to different volatility in the market to still provide accurate signals and confirmation. It will automatically show support and resistance in real-time. A Moving Average cloud with speeds varying from extra fast to slow; they will help traders confirm whether they should stay in the trade. Also, I added 2 stoplosses, because the importance of risk management should always be emphasized even with strong accuracy.
Features:
---The Most Accurate Signals on the planet.
--------Buy/Sell, Up/Down direction change, and Red/Green arrows.
--- MA cloud with beautiful color blend that can act as a confirmation of direction.
-------- 17 different types/versions of moving Averages to choose from.
--------Easy line transparency and toggle adjustments.
--------Easy cloud transparency adjustments.
--- Support and Resistance .
--- Advanced PSAR that will show red when bearish while in a bullish trend, and visa-versa.
---Potential Orderblocks that can be extended to show a grid (adding additional support/resistance information).
--- Fibonacci Lines.
--- Pivot bar that changes colors based on pivot direction.
---Resistance Breakout and Support Breakdown Signals .
--- Relative volume & momentum bar coloring.
---Two Separate Stoplosses .
--------Circles change color and flip to top and red for Short, bottom and green for long.
--------Horizontal stoploss that tracks the price and flags to take profit. White for Long and Yellow for short.
---As always... Fully customizable .
Different customization options:
Without stoplosses and Support/Resistance.
Without Support/Resistance, arrows and psar removed.
Added back Support/Resistance, lightened MA cloud
Fully loaded (minus trailing stoploss)

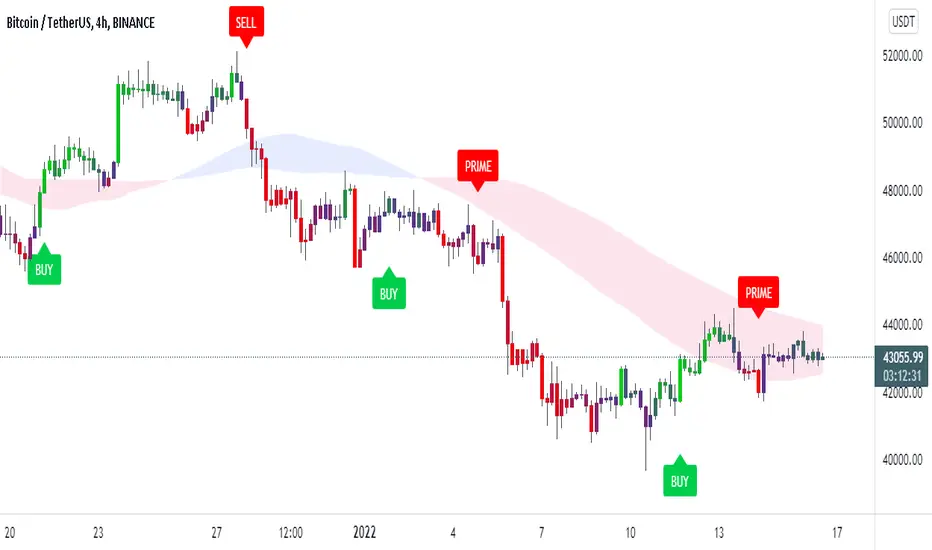
Trendorithm PrimeTrendorithm Prime is a toolkit made up of several different innovative indicators, designed by our team of developers. Get access now and create your own, unique trading strategies using our - all in one algorithm.
Our algorithm works in any market and focuses on finding the direction of the trends and remove noise from the price, for smooth understanding of the market.
Extra Confirmation
Using binomial distribution, the past values are processed to interpret the direction of trend.
After that, the signals are triggered based the volatility of the market,which is derived from the averages of candle size. All of these signals were optimised for each timeframe using timeframe multiplier.
Setting a lesser value on quotient adjusts the lookback length and volatility conditions, thus producing more number of signals that supports scalping trades. Higher the number in quotient, the frequency of trades reduce which helps the trader to hold trades for longer time.
Our Confirmation Signals helps to analyze the direction of trends for all markets and all timeframes, it boosts Trader’s confidence prior taking trades.
We made our Confirmation Signals flexible in order to suit any kind of trading style.
By adjusting the Quotient value in the settings, Traders can control the frequency of signals generated easily.
The Confirmation Signals includes a special type of signal called "Prime" which includes candle coloring to see the strength of the trend.
Our Candle-system is designed in 3 different colorings.
Green ( Bullish )
Red ( Bearish )
Purple (possible reversal or the possible formation of a new trend)
Trendo Cloud
The power of moving averages is always ultimate. This cloud made up of multiple moving averages acts as a dynamic support and resistance. The color and width of the cloud is used to find potential entry and exit points for trades.
Trend Catcher and Trend Chaser
The trend catcher is a trend-following indicator moves close to the price that aims to estimate the recent trend of price. It indicates green in uptrend and red in case of a downtrend.
The trend chaser is similar to the previous Trend Catcher, but it aims to chase long-term trends.
They are specially calculated from the highs and lows of price. Acts as a filter for confirmation signals and provides clarity for the direction of trend.
All of these functionalities tend to help users understand the market conditions as trending or ranging.
If you are using this script, you acknowledge that past performances are not indicative of future results and that there are a lot of factors required that go into being a profitable trader.
You can see the Author’s instructions below to get access to this prime indicator.
QaSH DCA AlgorithmQaSH DCA Algorithm implements a DCA strategy that takes advantage of price volatility by buying dips to average down, and adjusting price targets as the break-even price gets lower.
How does the DCA strategy work?
When the specified entry condition has occurred, the indicator will set up several limit orders below the current price. If price goes up a specified amount, then the layers will be overwritten at the higher prices. If price goes down and fills the first layer (limit order), then the Take Profit price is plotted and will be sent in an alert. If more layers are filled, then the TP price will move down accordingly as it’s based on the average entry price (alerts on each TP update). This action of lowering the average entry and TP price mitigates your risk, and increases the likelihood of a Take Profit event happening. More entry conditions will be added as time goes on, although complex entry conditions are not necessary for the strategy to work. All the meat of the DCA strategy is in the layer placement, order volume , and TP %.
How does this differ from other DCA bots?
1) The layer placements, order volume , and “take profit %” for each layer or “safety order” is much more customizable than what you get from other services. For example, I can choose to have my TP% change, depending on how big the price dip was. Maybe on safety order 1 I want 10% TP, but on safety order 7 might want a 2% TP.
2) Settings optimization. You can take advantage of the replay feature and see how trades would have played out, and how much PnL you would have made (strategy version is coming soon)
3) You can use this indicator on more than just crypto. You can easily set up alerts for manual trades on stocks, or you can integrate it with your stock broker API of choice and automate your trades.
4) When combining this with an automation service, you will get unmatched execution speed by running it on your dedicated machine.
5) I can offer a lifetime subscription to the indicator upon request.
What kind of market is it best used on?
QaSH DCA Algorithm is best used on cryptocurrencies and stocks, and it is best used on assets that are volatile. That means large swings up and down. Also I recommend running this on many uncorrelated assets at the same time.
What settings should I use?
The default settings are decent for most markets, and provide a good balance between profit potential and downside protection, although you can use a wide variety of settings. In a strong bull market its best to either bring up your layers to catch smaller dips, or you can go big on the first few layers (maybe 4 layers, 25% on each layer for example). In a sideways or brearish market you'll want more downside protection, so you'll want the larger orders to be at lower prices.
What should I do if price goes below my last layer?
The best solution is to keep a cash reserve on the side at all times. If price looks like it has reached a low point below your lowest layer, then manually buy more to average down further. This action will help it along and get you in the green sooner.
Disclaimer: In order to get a large position in an asset, you need to have most of your layers fill. That means you have to be comfortable with buying more as the price goes down, patiently waiting for the bounce that occurs afterward. This is the working principle of Dollar Cost Averaging, and it's a proven method for most markets.

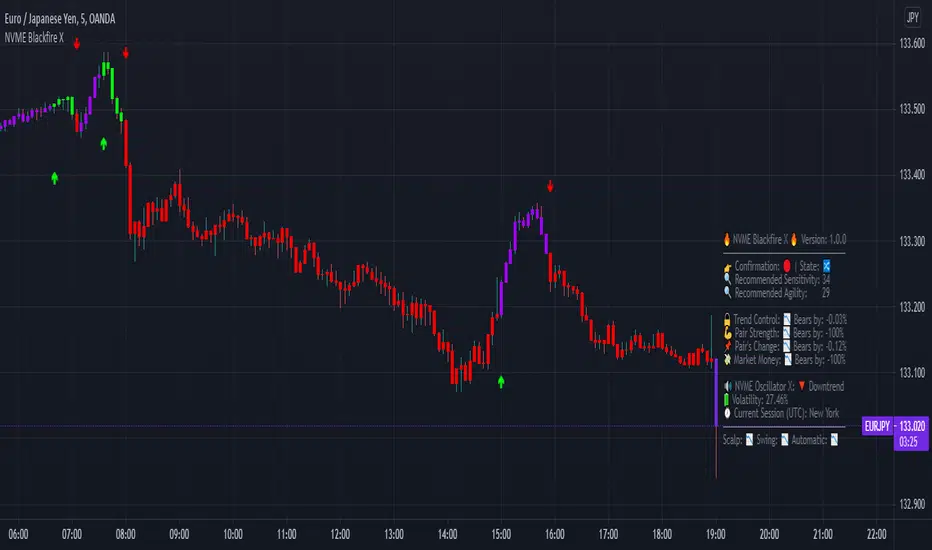
NVME Blackfire XNVME Blackfire X Indicator is a trend-confirmation indicator that includes Buy and Sell signals on the chart, Support & Resistance lines, Automatic Trendlines, Session Highs and Lows, Previous MTF Candle's Highs and Lows, Strategy Mode with Working Win/Loss Calculator, Built-In Position Size Calculator, Institutional Zones, Re-Entry Points and Filters, Customisable Market Dashboard and Alerts for Many Features.
The 2 main settings for the algorithm are 'Sensitivity' and 'Agility'. When you place Blackfire X onto your charts, you should be met automatically with the best settings we've found so far and don't worry if you are struggling to find settings because our system has an onboard system that provides you with an automatic "Best Settings" for the current pair that you are on. You can choose to enable this feature on the algorithm settings or simply see what is ideal on the dashboard too.
The 'Sensitivity' controls how quickly the algorithm responds to the market's trend changes. The higher the sensitivity, the less trades on the chart. The lower the sensitivity, the more trades you'll find on the chart.
The 'Agility' controls where the signals are placed within the trend change, a lower agility will give you signals closer to its reversal points and a higher agility will give you slower signals.
We also have the option to change the indicator to your trading style, there are four modes that heavily impacts the algorithm's calculations.
These are "default", "swing mode", "scalp mode", "strategy mode".
"Default" is our normal algorithm module that utilises the user's input to provide signals using a basic filtration system.
"Swing Mode" is our algorithm that has been modified to give signals that are more delayed for swing traders.
"Scalp Mode" is our algorithm that has been modified to give signals that are quick and fast for scalps.
"Strategy Mode" utilises our default mode but instead places the user in a mode where trades will only appear if a stop loss or a take profit area has been met by the price after the signal call.
Our third key option is our bar colour switches, there are multiple options such as "Cloud-Based", "Pivot Based", "S/R Based", "Change-Based" and "Two Colour Modes". NVME Blackfire X colours the candles in the direction of the trend and a green colour shows an uptrend, a purple colour shows an unconfirmed trend or often a ranging area and a red colour shows a downtrend.
We must let traders know that the signals should be used carefully and with a trader's strategy rather than following signals for the sake of it being printed there!
Since we want this algorithm to have necessary features and respond fast too, we have chosen only trend-following and analysis features that will be quick to use and easy to understand. We want this to be different from our Vanquisher X algorithm as that is a massive multi-tool full of features for traders to enjoy.
The first main feature is our 'Trend Cloud' system, it utilises two moving average plots that creates a cloud filling and with our algorithm you can customise both of the moving averages to any currently existing moving average in the PineScript Library.
The second feature is our 'Institutional Zones' system, which plots area of the market where the institutions have placed orders and these can be used as an extra support and resistance zone for trades. There is an input option that allows the user to get more or less zones and it is called "The Detection Strength", increasing this will show more zones whilst decreasing it will show less.
The third feature is our 'Automatic Trendlines' system, which utilises two input methods ('Trendline Period' and 'Trendline Detection Ratio'), the period controls how many bars of data to lookback to for the trend-lines and the detection ratio controls how many trend-lines are plotted onto the chart.
The fourth feature is our 'Session High and Lows' system, which plots the highest high and the lowest low of each session in the trading hours, these plots can be useful for breakout traders.
The fifth feature is our 'MTF Candle Info' system, which plots the candle's high and low or the candle's open and close for a timeframe and the previous candle of choice. This can also be used for breakout traders such as having a lower timeframe breakout for a higher timeframe plot.
The sixth feature is our 'Adaptive S/R Zones', which plots support and resistance zones into any market pair that are accurate points at which the market could react and reject from.
* Informative Market Dashboard *
Our simple panel on your chart displays the most relevant data from all of our features and calculations in real-time.
Confirmation
The confirmation simply tells the user what the previous signal was and this can be useful if the user may decide to have their signals turned off on the charts.
Market State
The market state informs the user the direction of the trend whether it be ranging, in an uptrend or downtrend, you'll see the emoji that corresponds to that.
Recommended Sensitivity
This feature will show the user what the recommended sensitivity is for the current pair that the user is on and the user may find this helpful if they don't know what settings to use.
Recommended Agility
This feature will show the user what the recommended agility is for the current pair that the user is on and the user may find this helpful if they don't know what settings to use.
Trend Control
The trend control feature calculates data using the user set bars back input and it determines all the factors within the trend to give you an informative response, an uptrend will have "Bulls by: " + percentage of control and a downtrend will have "Bears by" + percentage of control.
Pair Strength
The pair strength is measures the control of bulls or bears in the form of the market strength and it will give the same response as the trend control but the percentage will be based on the buying or selling pressure.
Pair's Change
The pairs change measures the change in price from point A to point B, if the change is greater than 0%, the dashboard will inform you that Bulls are in control, and if not the dashboard will inform you that Bears are in control.
Market Money
The market money measures the amount of volume and money that is going into the current asset and if the net change is greater than 0%, bulls will be in control, if not then bears are giving the market their money.
NVME Oscillator X
This is our very own oscillator that has been integrated into our dashboard, allowing the user to see the trend of our other indicator without having to fill their charts up with more noise. If the oscillator is in a downtrend then the dashboard will state that its in a downtrend and if it is in an uptrend then it will show an uptrend text.
Volatility
This feature measures the amount of volatility in any pair and provides user with the percentage value so they can see whether or not the market is extremely volatile at the current time.
Current Session
This feature will tell the user what session they are currently on such as London, Europe, New York, Asia, Australia.
MechaOscillatorWhat is MechaOscillator?
MechaOscillator was created as a companion to our main script MechaAlgo. Using MechaOscillator along with MechaAlgo will allow you to boost your overall understanding of any market, and make more informed decisions as a trader.
Feature List
Built-In Improved WaveTrend Oscillator
Buy & Sell Signals
Bullish and Bearish Divergences
Short and Long Term Trend Indicators
Trend Strength Indicator
Market State Indicator
Real Time Informational Dashboard
Bullish and Bearish Breakout Indicator
Many More Features to Come!
By using this script you acknowledge that MechaOscillator cannot guarantee you profit, and that this product was only created in attempt to benefit traders. You also acknowledge that past performance is not indicative of future results, and that the experience of other users or what you see online may not always be your experience.

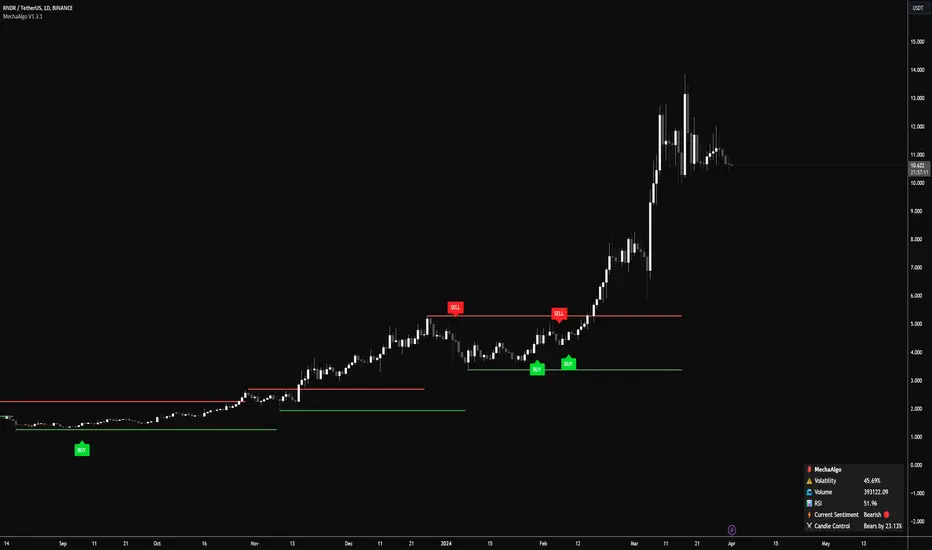
MechaAlgoWhat is MechaAlgo?
MechaAlgo was created to assist any type of trader on a day to day basis. Our intelligent and accurate algorithms turn complex charts into profitable plays, minimizing losses and maximizing profits. We hope that you will find use in the tools and resources we provide, and we will continue to improve on our products in order to take your trading to new heights!
Any Time, Any Market
Our indicators work with real time data on any market. This means that any kind of trader will find our tools useful, regardless of what you are trading.
Feature List
Multiple Signal Modes
Numerous Candle Coloring Modes
Reversal Cloud Overlay
Auto Support & Resistance
Auto Trendlines
Auto Profit Targets
Real Time Informational Dashboard
Multi-Timeframe Trend Panel
Future Trend Projection
Many More Features to Come!
By using this script you acknowledge that MechaAlgo cannot guarantee you profit, and that this product was only created in attempt to benefit traders. You also acknowledge that past performance is not indicative of future results, and that the experience of other users or what you see online may not always be your experience.
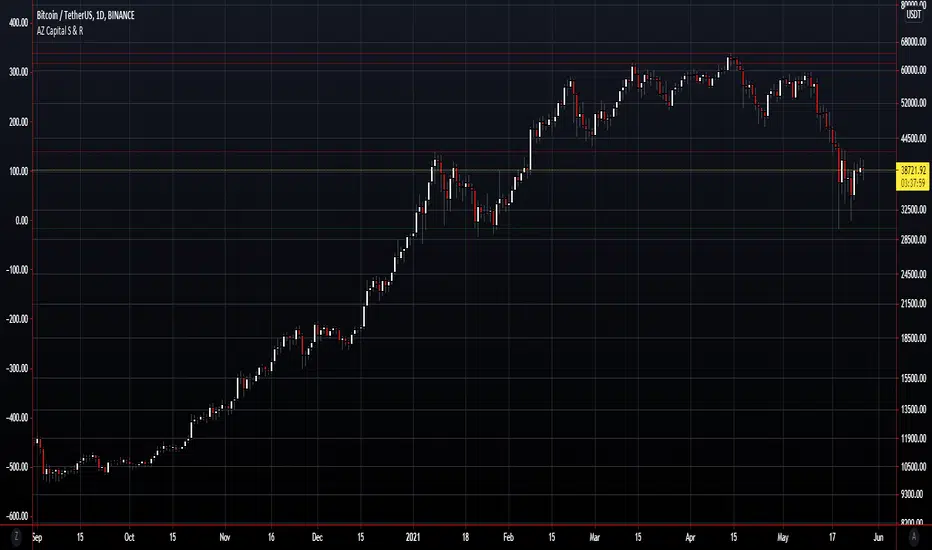
AZ Capital S & ROverview
The algorithm endeavours to robotize the identification of support and resistance levels by recognizing enormous swings/turns in authentic value activity.
These tops and bottoms in value activity shows where the bunches of buyers or sellers came into the market and may go about as future degrees of support or resistance.
The code identifies the last 3 huge swing highs and the last 3 swing lows. It at that point places lines on the outline to feature those levels.
In support and resistance hypothesis, frequently the support becomes resistance and the other way around. Along these lines, the algorithm doesn't just sort swings lows as "support" and swing highs as "resistance". All things considered, the algorithm takes a gander at the swing position comparative with the current close cost.
In the event that the price is over the level, the algorithm thinks of it as support. On the off chance that the price is beneath the level, the algorithm believes it to be resistance.
In light of this, the lines are naturally shaded by whether the prices are above or beneath the current close cost. At the point when any of the levels are beneath the nearby value, the lines are shaded green. Then again, at whatever point they are over the nearby, they are shaded red.
NVME Vanquisher X"Enter with precision, focus on the mission, dismiss the indecision, support NVME's vision" ~ That is what the Vanquisher X will provide.
One may ask, what is so unique about it compared to other algorithms?
We have our own calculation module and strategy that uses other indicators and maths to determine the next location of the trend and with our algorithm you can have full customisation of all the features we have. You can change the overall colour scheme of every single plot within the indicator, you can change the algorithms sensitivity and scalar to as many different numbers as possible, there are helpful drawings, trend confirming drawings, pullback drawings, pair mark-ups, custom dashboards and much more. Our settings panel is also simple and easy to use providing you with different appropriately named subsections for each feature and there are tooltips to let you know what each tab or input does. So, traders if that doesn't get you hooked then keeping reading!
Traders commonly struggle to decide whether or not to enter a trade, hold a trade, stop a trade or take profit and that is what makes us different. You stop when you see the opposite signal or a change in candle colour, you can follow our automatic TP and SL levels for trade goals and you enter when a signal meets your analysis.
NVME Vanquisher X is to be used as confluence with your analysis or trading style and should not in anyway shape or form be used as a indication to buy or sell just because the signal says so, it is there to give you a higher chance of having a high probability trade though past results is not indicative of future results and getting access doesn't mean you will become a millionaire in a day as it is not a get rich quick indicator so it won't guarantee 100% success.
What is your goal?
Our goal is to give you traders an edge in trading, whether it be for stocks, indices, cryptos, forex, commodities, futures and altcoins, all assets are supported and we want to make the best of every trader with NVME.
Recommended Timeframes:
15 Minutes, 1 Hour, 4 Hour with our settings of 2 or 3 sensitivity and 144 on the algo scalar.
Does it support all chart types?
Yes, all charts supported, however we recommend Heikin-Ashi as an optimal choice for trading but if you are already experienced with something else then you can use that :)
Screenshots:
Features:
/Trend Confirming Drawings:
-200 EMA (Added so that free users don't have to waste 1 indicator space)
-Trend Cloud (Colour switches from negative to positive depending on the trend and the cloud has a low fill opacity)
-Confirmation Highlight (Highlights the background with a positive or negative colour depending on the trend identified)
-Following Highlight (Unique highlighting to the background that shows either a positive or negative colour based on the trend however it doesn't identify ranging markets)
//Combinations//
-TC+EMA, EMA+Highlight, Cloud+Highlight, FH+EMA, FH+CLOUD, All v1 (EMA+CLOUD+CH), All v2 (EMA+CLOUD+FH)
/Helpful Drawings:
-Predictive Channel (Using candle maths, this will plot a price following linear regression channel that can be useful for breakout trading or using as support and resistance)
-Predictive S/R (Using candle maths and validation, this will plot support and resistance zones across the market to show you different areas where price could reject or reverse)
-Predictive Trend-Lines (Using candle maths and EMA, this will plot a trend-line in the direction of the trend and this can be useful for breakout trading or following the trend)
-Predictive Supply and Demand Highlight (Using other indicators, this will plot a highlight filled plot that will outline areas of supply and demand, which can be useful for support and resistance trading)
-Previous Order Blocks (Using candle maths, validation and confirmation latency, this will plot filled in squares of potential orders blocks from the past so they can be used for future reference in analysis)
-Predictive ZigZag (Using candle maths, this will plot a price following line that forms a zig zag pattern to show if the market is going in a higher high and higher low formation or lower low and lower high formation)
-Predictive Pivot-Points (Using candle maths and higher-timeframe data, this will plot pivot zones up to support 5 and resistance 5 with midpoints for every section there is)
/Pullback Drawings:
-EMA Pullback (Added so that free users don't have to waste 1 indicator space)
-Bollinger Heatbands (Using the Bollinger Bands indicator, we have created a price following support and resistance heat-map that shows you the whereabouts of the dynamic support and resistance that is indicator based)
-EMA+HB (This combines the ema and the heatbands)
-Fib Retracements (This feature will automatically plot a fibonacci retracement based off predictive market data and our own optimal settings so that you don't need to change them)
/Pair Mark-Ups:
-Weekly Info (This will show you the previous lows and high of the weekly candle and using an ATR, we have added potential reversal zones in those areas and we have a midpoint too)
-Daily Info (Same as the weekly info but for the daily timeframe)
-4 Hr Info (Same as the weekly info but for the 4 hourly timeframe)
/Colour Schemes:
-Default (Strong green, dark purple, strong red)
-Blue and Orange
-Strawberry and Lime
-Apple and Mango
-Orange Passionfruit
-Rhubarb and Custard
-Black and White
-Forest Greens
-Galaxy
-No Colour Scheme (removes the preset colours so they are the same as your TradingView bar settings)
-Show ATR TP and SL levels (This will plot 4 lines, 3 lines are the take profit levels, and the 4th line is the stop loss line, since it is atr based it may fluctuate the distance between each line indicating possible liquidity)
/Dashboard Settings
-High (Will place the dashboard's Y position to follow the high of the price)
-Middle (Will place the dashboard's Y position to the difference of the lowest low and highest high)
-Forced Middle (Will place the dashboard's Y position to the difference of the lowest low further back and highest high further back)
-Low (Will place the dashboard's Y position to follow the low of the price)
-No Dashboard (Deletes the dashboard from the charts)
-Dashboard's X position (Input field, this will change the X value, the higher it is the further away it is from price and the lower it is the closer the dashboard is towards price)
/Dashboard W/R Goals:
-Adaptive (Randomly chooses a strategy follow, can be highly inaccurate, and when price hits tp 1 it will add a win and if it hits sl it will count as a loss)
-5 Pips to 5 Pips (This will change the calculator to only add values for this set condition and this won't be strategy based but instead signal based)
-5 Pips to 10 Pips (1:2 Risk Reward)
-10 Pips to 20 Pips (1:2 Risk Reward, Higher Stop and TP)
-10 Pips to 30 Pips (1:3 Risk Reward, Higher Stop and TP)
-20 Pips to 40 Pips (1:2 Risk Reward, Higher Stop and TP)
/Dashboard Add-ons:
-MTF Trends (This will add more text onto the dashboard and this will show you the trends of the higher timeframes)
-EMA (This will show you the EMA trends on the dashboard)
-VWMA (This will show you the VWMA trends on the dashboard)
-HMA (This will show you the HMA trends on the dashboard)
-Text Colour (This is a colour input and this allows you to change the colour of the dashboard to anything you like)
/Customisable Alerts:
-Buy Alerts (This will allow buy alerts to be sent through any TradingView notifications)
-Sell Alerts (This will allow sell alerts to be sent through any TradingView notifications)
-Range to Uptrend (May be buggy, this will send an alert if the colour goes from undecided to an uptrend colour (positive colour))
-Range to Downtrend (May be buggy, this will send an alert if the colour goes from undecided to a downtrend colour (negative colour))
-Previous Bullish Order Block (This will send an alert if a previous bullish order block has been printed to help with your analysis)
-Previous Bearish Order Block (This will send an alert if a previous bearish order block has been printed to help with your analysis)

Orion AlgoOrion Algo is a next-gen trading algorithm designed to help traders find the highs and lows of the market before, during, and after they happen. We wanted to give an indicator to people that was simple to use. In fact we created the algorithm in such a way that it currently only needs a single input from the user. Since no indicator can predict the market perfectly, Orion should be used as just another tool (although quite a sharp one) for you to trade with. Fundamental knowledge of price action and TA should be used with Orion Algo.
Being an oscillator, Orion currently has a bias towards market volatility. So you will want to be trading markets over 30% volatility. We have plans to develop future versions that take this into account and adjust automatically for dead conditions. Also, while there are some similarities across all oscillators, what sets ours apart is the prediction curve. The prediction curve looks at the current signal values and gives it a relative score to approximate tops and bottoms 1-2 bars ahead of the signal curve. We also designed a velocity curve that attempts to predict the signal curve 2+ bars ahead. You can find the relative change in velocity in the Info panel. The bottom momentum wave is based on the signal curve and helps find overall market direction of higher time-frames while in a lower one.
Future Roadmap:
Create secondary on-bar indicator to pair with Orion Algo
Automatically adjust internal variables based on market volatility
Indicator style selection
Simple Strategy:
1. Start at a high time-frame to get an overview of the market you are wanting to enter. Daily is usually a good starting time.
2. If you can, add Orion to a second chart with a lower time-frame such as 4H.
3. Check the lower time frame to find potential medium term entry points based on where the trend was heading from the higher time-frame.
4. Step even lower to the 1H to find your optimal entry based on the higher times and technical analysis of the charts (support/resistance, patterns, etc)
5. The momentum wave can be used to find overall trend of the market. When it starts curving up, the market is bullish. When it curves down, the market could be bearish.
Intermediate Strategy:
1. Use simple strategy first.
2. Use the Prediction and ∆v curves to see future reversals in the works.
3. You can use these curves as potential entries as well as exit points.
4. Take into account potential divergence of the signal lines and price action.
Settings and How to Use them:
User Agreement – Orion Algo is a tool for you to use while trading. We aren’t responsible for losses OR the gains you make with it. By clicking the checkbox on the left you are agreeing to the terms.
Super Smooth – Smooths the main signal line based on the value inside the box. Lower values shift the pivot points to the left but also make things more noisy. Higher values move things to the right making it lag a bit more while creating a smoother signal. 8 is a good value to start with.
Theme – Changes the color scheme of Orion.
Info – Turns on a dashboard with useful stats, such as Delta v, Volatility, Rsi, etc. Changing the value box will move the dashboard left and right.
Pivots – Toggles main bull/bear dots.
Prediction – A secondary prediction model that attempts to predict a reversal before it happens (0-2bars). This can be noisy some times so make your best judgement. Curve will toggle a curve view of the prediction. Pivots will toggle bull/bear dots.
∆v – Delta v (change in velocity). This shows momentum of the signal. Crossing 0 signals a reversal. If you see the delta v changing direction, it may signify a reversal in the several bars depending on the overall momentum of the market.
Divergence – Toggles divergence lines. Hidden will show hidden divergences. Cross will show divergences that cross the 0 line.
Momentum Wave – Uses the signal as a macro trend indicator. Changes in direction of the wave can signify macro changes in the market. Average will toggle an averaging algorithm of the momentum waves and makes it easy to understand.
OBOS – Overbought/Oversold lines. Dyn will convert them to dynamic OBOS lines. The value box will adjust the smoothing.
TV Community AlgoTV Community Algo is a free TradingView script that I designed from the ground to benefit the traders of this community. It has plenty of features that you will enjoy, and I have included documentation for how to use this below!
Settings:
Basic:
Turn the Void Lines on or off
Turn the Dashboard on or off
Turn the Signal Bars on or off
Turn the Support & Resistance Lines on or off
Turn the EMA 8 and EMA 200 on or off
Turn the Buy & Sell Signals on or off
Turn the Fibonacci Retracement Tool on or off
Style:
Change the Dashboard's distance from the price action
Change the Dashboard's Color and Transparency
Change the Dashboard Text Color
Change the Fibonacci Deviation
Make the Fibonacci Retracement Tool reverse
Make the Fibonacci Lines extend left, right, both directions, or none
Turn Fibonacci Prices on or off
Turn Fibonacci Levels on or off and change between percent or value
Change Fibonacci Label Position from the left or the right
Usage:
This algo has many uses including but not limited to:
Finding entries and exits using the EMA 8 and EMA 200 crossovers
Using the Void Lines to identify bounces or reversals
Using the Signal Bars to identify trend and confirmation for entries and exits
Using the Dashboard information for confirmation and informational purposes
In the images below, I give a few examples of the many uses of the TV Community Algo!
VOID LINES
The Void Lines are very helpful when it comes to identifying reversals.
TV COMMUNITY ALGO DASHBOARD
The Dashboard is filled with useful information that all traders can benefit from!
SIGNAL BARS
The colored candles known as Signal Bars inform you of when the price action is above or below the midpoint of the Void Lines.
AUTO SUPPORT & RESISTANCE LINES
These lines help traders find accurate levels of support & resistance on all time frames, and the lines change color depending on if the price is above or below them.
EMA 8 AND 200
The EMA 8 and EMA 200 crossovers can be used as entry and exit signals.
BUY & SELL SIGNALS
The BUY & SELL signals can be used to find optimal entries and exits for trades on any time frame. Smaller time frames are best for scalping, while larger time frames are more suited for longer trades. When combined with the EMA lines and Dashboard information, these signals can produce incredibly profitable trades.
AUTO FIBONACCI RETRACEMENT TOOL
The Auto Fibonacci Retracement Tool allows you to plot perfect Fib Lines every time.
Conclusion:
I truly hope that the TV Community Algo benefits the TradingView community and that you all find some value in it. I worked very hard on this product and I would love to see it put to good use.
with love,
-Lemon 🍋
This work is licensed under a Attribution-NonCommercial-ShareAlike 4.0 International (CC BY-NC-SA 4.0) creativecommons.org

AZ Capital Lite 2.0
AZ Capital Lite 2.0 is the Updated Version of our Previous Lite Version of our trading algorithm/indicator. This algorithm is once again based on different indicators such as RSI and a combination of MA's along with ATR. Custom values that provide assistance to our PRO trading algorithm helping concluding analysis and finalising a trade even better.
AZ Capital Lite 2.0 combines various default indicators with custom values into One simple algorithm that helps the user to assess if an asset is moving upward or downwards.
AZ Capital Lite 2.0 works perfectly along with our AZ Capital PRO algorithm/indicator and helps the user to finalise the movement of an asset.
For Past Performances of this Algorithm/Indicator, Contact me Privately!
If you have any doubts on how to use the Algorithm/Indicator, Contact me Privately!
Commenting is RESTRICTED to only Comments about the Algorithm/Indicator and NOT asking for HOW-TO's and ACCESS!
Always DYOR and Trade Safely!
Regards,
Azyad (Founder of AZ Capital)
